Home » Posts tagged 'iOS'
Tag Archives: iOS
Tablet and smartphone market trends
September update: Qualcomm’s smartphone AP revenues declined 17% year-over-year in the second quarter of 2015, Strategy Analytics estimated. Qualcomm maintained its smartphone AP market share leadership with 45% revenue share, followed by Apple with 19% revenue share and MediaTek with 18% revenue share. For the rest 18%: After a difficult 2014, Samsung LSI continued to recover and more than doubled its smartphone AP shipments in the second quarter of 2015 compared to the same period last year. Samsung LSI capitalised on its Galaxy S6 design-win in Q2 2015. In addition the company featured in multiple mid-range smartphones from Samsung Mobile. Full report: Smartphone Apps Processor Market Share Q2 2015: Samsung LSI Maintains Momentum
… The global tablet AP market declined 28% year-over-year to reach US$679 million in the second quarter of 2015, according to Strategy Analytics. Apple, Intel, Qualcomm, MediaTek and Samsung LSI captured the top-five revenue share rankings in the market during the quarter. Apple led the tablet AP market with 27% revenue share, followed by Intel with 18% revenue share. Qualcomm ranked number three, narrowly behind Intel. ![GT400150821[1]](https://lazure2.wordpress.com/wp-content/uploads/2015/08/gt4001508211.jpg?w=960) Full report: Tablet Apps Processor Market Share Q2 2015: Apple and Intel Maintain Top Two Spots
Full report: Tablet Apps Processor Market Share Q2 2015: Apple and Intel Maintain Top Two Spots
…
Digitimes Research saw global tablet shipments fall to 45.76 million units in second-quarter 2015, showing a 10% decrease on quarter and representing more than a 15% decrease on year. Full report: Global tablet market – 2Q 2015 End of September update
Investors.com comments on tablet and smartphone market trends — Q2’2015: 1. Apple, Samsung lose ground in tablet market — LG and Huawei gain
2. Apple, Huawei [and Xiaomi] buck slowing smartphone sales trend
As the commenting articles by Investors.com are based on press releases of 2 market research companies I will give the web reference here for those press releases themselves, as well as 3 other press releases not commented on by Investors.com (if there are trend indications in the press releases themselves I will copy them alongside the web reference):
- July 29, 2015: Worldwide Tablet Market Continues to Decline; Vendor Landscape is Evolving, According to IDC
 “Longer life cycles, increased competition from other categories such as larger smartphones, combined with the fact that end users can install the latest operating systems on their older tablets has stifled the initial enthusiasm for these devices in the consumer market,” said Jitesh Ubrani, Senior Research Analyst, Worldwide Mobile Device Trackers. “But with newer form factors like 2-in-1s, and added productivity-enabling features like those highlighted in iOS9, vendors should be able to bring new vitality to a market that has lost its momentum.”
 - July 30, 2015: Huawei Becomes World’s 3rd Largest Mobile Phone Vendor in Q2 2015 [says Strategy Analytics]

- Woody Oh, Director at Strategy Analytics, said, “… Smartphones accounted for 8 in 10 of total mobile phone shipments during the quarter. The 2 percent growth rate of the overall mobile phone market is the industry’s weakest performance for two years, due to slowing demand for handsets in China, Europe and the US.”
- Neil Mawston, Executive Director at Strategy Analytics, added, “… Samsung has stabilized volumes in the high-end, but its lower-tier mobile phones continue to face intense competition from rivals such as Huawei in Asia. … Apple outperformed as consumers in China and elsewhere upgraded to bigger-screen iPhone 6 and 6 Plus models.”
- Ken Hyers, Director at Strategy Analytics, added, “… Huawei is rising fast in all regions of the world, particularly China where its 4G models, such as the Mate7, are proving wildly popular. Huawei has finally overtaken Microsoft to become the world’s third largest mobile phone vendor for the first time ever.”
- Neil Mawston, Executive Director at Strategy Analytics, added, “Microsoft shipped 27.8 million mobile phones and captured 6 percent marketshare worldwide in the second quarter of 2015. Microsoft’s 6 percent global mobile phone marketshare is sitting near an all-time low. Microsoft continues to lose ground in feature phones, while its Lumia smartphone portfolio is in a holding pattern awaiting the launch of new Windows 10 models later this year. Xiaomi shipped 19.8 million mobile phones and captured 5 percent marketshare worldwide in Q2 2015. Xiaomi remains a major player in the China mobile phone market, but its local and international growth is slowing and Xiaomi is facing intense competition from Huawei, Meizu and others. As a result, Xiaomi may struggle to hold on to its top-five global mobile phone ranking in the coming quarters.”
- June 17, 2015: Business smartphones shipments in Q1 up 26% from last year, now 27% of total smartphone market [says Strategy Analytics]
 Android was the most dominant OS in terms of business smartphone shipments in Q1, accounting for nearly 60% of all business smartphones (corporate- and personal-liable). It was also the dominant BYOD device; 68% of personal-liable shipments in Q1 were Android. Apple iOS accounted for only 27% of BYOD shipments in Q1, but was the dominant platform in terms of corporate-liable smartphones, with 48% of Q1 CL shipments. The difference in Android/iOS shipments between the CL and IL categories reflects the continuing corporate perception that iPhones are “safer” than Android-based devices.
- Shipments of personal-liable smartphones (i.e. “bring your own device,” or BYOD, phones) drove market growth in Q1
- Strategy analytics defines personal-liable devices as devices purchased by the end-user and expensed back to the company or organization, or devices purchased outright by individual users but used primarily for business purposes linking to corporate applications and backend systems.
- While personal liable devices dominate worldwide business smartphone shipments, some regions are more resistant to the BYOD trend than others. Such regions include Western Europe and Central Europe, where corporate-liable devices are the dominant types of business smartphones. In Western Europe in Q1, 61% of the 10 million business smart phones were corporate-liable. Central and Eastern Europe had a slightly higher rate of BYOD devices shipped in Q1 — 41% — but the majority of smartphones shipped in this regions was also corporate-liable. This a sharp contrast to North America, where three-quarters of business smartphone shipments are personal-liable. The trend in Western and Eastern Europe reflects the more corporate-centric approach businesses take to mobility in these regions.
- July 29, 2015: Mobile Broadband Tablet Subscriptions to Double to 200 Million by 2021, says Strategy Analytics

- Strategy Analytics forecasts global mobile data subscriptions on tablets will more than double from 2015 to 2021, reaching over 200 million
- Around the globe, over 100 million wireless connections on cellular enabled tablets will be added through 2021. By 2021 tablets will only account for 2 percent of total mobile subscriptions, a 2.7 percent population penetration rate.
- July 29, 2015: Intel Maintains Top Spot in Non-Apple Tablet Apps Processors in Q1 2015 says Strategy Analytics
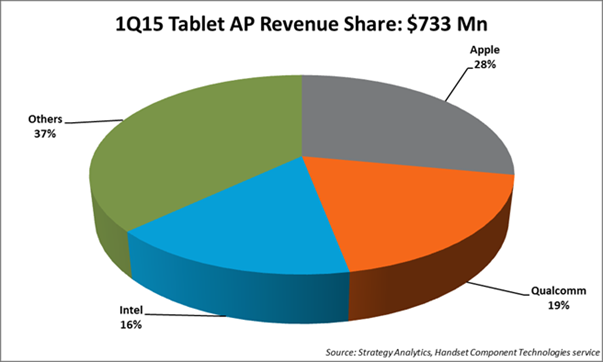
⇒The global tablet applications processor (AP) market declined -6 percent year-over-year to reach $733 million in Q1 2015- According to Sravan Kundojjala, Associate Director, “Intel maintained its top spot in the non-Apple tablet AP market in unit terms in Q1 2015. Strategy Analytics estimate Android-based tablets accounted for over 70 percent of Intel’s total tablet AP shipments in Q1 2015. We expect Intel’s Atom X3 cellular tablet chip product line to help Intel maintain its momentum in the tablet AP market.”
- Stuart Robinson, Executive Director of the Strategy Analytics Handset Component Technologies (HCT) service added, “Strategy Analytics estimates that baseband-integrated tablet AP shipments accounted for over one-fourth of total tablet AP shipments in Q1 2015, helped by a strong push from Qualcomm, MediaTek and Spreadtrum. We expect continued momentum for integrated APs as Intel, Rockchip and others join the bandwagon.”
- July 30, 2015: Windows Tablet Shipments Nearly Double in Q2’15, says Strategy Analytics
⇒Global Tablet Shipments and Market Share in Q2 2015 (preliminary)
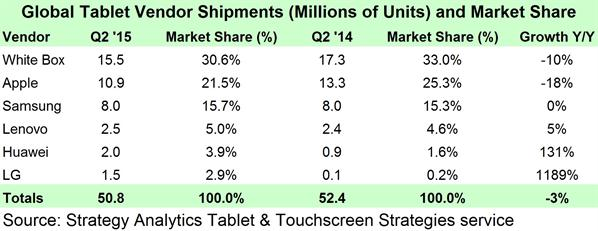
- Windows-branded Tablets comprised 9 percent of shipments in Q2 2015, up 4 points from Q2 2014
- Android-branded Tablet shipment market share was flat at 70 percent in Q2 2015
- Apple continued its slide in market share down to an all-time low of 21 percent in Q2 2015, 4 points lower than Q2 2014
- Vendors with strong 3G and LTE connected Tablet strategies such as Huawei, LG, and TCL-Alcatel gained market share as leaders like Apple, Samsung, and the White Box community lost ground


Tablet & Touchscreen Strategies Senior Analyst Eric Smith added, “Windows share continues to improve as more models become available from traditional PC vendors, White Label vendors, and Microsoft itself though a healthy Surface lineup and distribution expansion. The key going forward will be if the coming wave of 2-in-1 Detachable Tablets is a hit with consumers or if they go the way of the Netbook—we remain cautiously optimistic on this point.” |
Tablet & Touchscreen Strategies Service Director Peter King said, “Apple’s fortunes will turn around soon as it will launch the 12.9-inch iPad Pro as well as an iPad mini 4 in Q4 2015. New features in iOS 9, which are exclusive to iPad such as multi-tasking and a more convenient soft keyboard, will also help compel upgrades by owners of older iPad models. Meanwhile, Huawei and LG have posted fantastic growth primarily due to well-executed 3G and LTE connected Tablet strategies.” |
Then I will add 2 additional information pieces from Strategy Analytics:
Oct 8, 2014: Replacement Demand to Boost PC Sales in 2015, says Strategy Analytics
Having experienced negative growth since 2012, global PC sales are expected to rise 5 percent in 2015 driven by replacement of an ageing installed base according to Strategy Analytics’ Connected Home Devices (CHD) service report, “Computers in the Post-PC Era: Growth Opportunities and Strategies.”
Click here for the report:
http://www.strategyanalytics.com/default.aspx?mod=reportabstractviewer&a0=10146
- PC sales will fall by 4 percent in 2014 before returning to modest growth in 2015 and beyond to support replacement demand.
- Strategy Analytics’ consumer research of computing device usage in developed markets indicates that PCs remain essential computing devices despite healthy Tablet sales.
- Frequent Tablet usage has grown by 22 percentage points from 2011 to Q4 2013 up to 32 percent of all households while frequent Mobile PC (excluding Tablets) usage has stayed steady through this period, as 63 percent of all households indicated they frequently used Mobile PCs.
- Frequent usage of all PCs (including Mobile and Desktop PCs and excluding Tablets) remained above the 90 percent mark of all households, falling only 3 percentage points during this period.
Quotes:
Eric Smith, Analyst of Connected Home Devices, said: “Multiple PC ownership is falling as Tablet sales supplant replacement demand for secondary PCs mainly used for casual tasks. Still, PCs will remain essential devices as households eventually replace their primary PCs used for productivity tasks such as spreadsheet and video editing or personal banking.”
David Watkins, Service Director, Connected Home Devices, added: “The modern Tablet user experience is quickly arriving on the PC thanks to more affordable 2-in-1 Convertible PCs and new operating systems which blend traditional PC and Tablet user experiences. We see development of these forces aligning perfectly with an older PC installed base ripe for replacement in 2015.”

May 1, 2015: Children Change Disney’s Digital Strategy: “App TV” Now Central To Content Planning by David Mercer
Multiscreen TV behaviour is at the centre of television’s stormy transformation – viewing of broadcast, linear TV on the TV screen is apparently in decline while consumption on smartphones and tablets is increasing. Making sense of the big picture is increasingly challenging, and legacy players like broadcasters and the major content owners are inevitably somewhat resistant to the idea that their traditional businesses are under serious threat.
We have monitored the early stages of this transformation for the past decade and see its results in our own research, and we continue to predict further industry disruption in our forecasts. But sometimes it is only when you hear the evidence given in person by a senior executive at a leading global player that the scale of the challenge and opportunity are finally brought home.
This happened at last week’s AppsWorld event in Berlin, where I chaired the TV and Multiscreen conference. The speaker was Andreas Peters, Head of Digital for the Walt Disney Company Germany, Austria and Switzerland. Andreas presented some of the most compelling evidence I have yet heard that television is truly a multiscreen medium for the next generation of viewers.
Disney’s challenge in Germany was to launch a television show called Violetta aimed at 8-12 year old girls. It had been introduced successfully in Argentina but had failed in the UK. As it often does, Disney had invested considerable amounts in merchandising and retailers were eagerly anticipating sales of the new product lines. The show was first broadcast on German free TV on May 1st 2014 but it achieved only very low ratings.
The question for Disney managers was whether traditional TV had stopped working. A crisis meeting was held with a view to writing off the investment. Disney had previously not made its shows available online in Germany but the Violetta situation was so serious they were persuaded to experiment. Two episodes were made available on Youtube with a link to Disney’s own website. Viewing of the content on Youtube very quickly went viral until Disney had achieved a reach of 50% of 8-12 year old girls and eight million views. Violetta went on to become a success in German-speaking markets.
The evidence was clear: for some shows at least, younger children cannot now be reached using the traditional broadcast TV/big screen model. Peters explained that the Violetta experience was transformative for the Disney organisation and led to the inclusion of online and digital media as a key element in the business case for many products. In fact it also led to the development and launch of Disney’s own Watch App, which includes live streaming and seven-day catch-up programmes from the broadcast Disney Channel.
Even after the Violetta experience Disney was sceptical that an app was needed – there was a feeling that the website would be sufficient. Nevertheless the app was launched and Disney had planned for 20,000 downloads. Instead it has passed one million downloads in its first six months. Peters noted: “This was a real shock for us. We completely underestimated the demand.” Around 500,000 viewers are now using the Disney Watch app for linear television viewing, in addition to millions of shows being downloaded for catch-up viewing. Peak app viewing hours are between 6am and 8am and then between 1pm and 9pm on school days, with a different pattern at weekends. Peters made it clear that children did not want lots of features built in to the app – just like TV, they just want to hit “play” and watch.
“Our TV colleagues of course don’t want to believe this,” said Peters. “But the world has changed and it will continue to change.” Disney has also seen a knock-on effect from its app launch with an increase in free-to-air broadcast TV viewing. But the firm is now clear that mobile is not just an add-on to TV or a promotional tool; it must be an integral part of the entire process.
There are many implications for content strategy. TV and Digital have to “understand each other”, which is a challenge when the KPIs in each world are very different. As we have often heard, the video industry is crying out for a set of common metrics which can apply and support advertisers in both TV and online worlds. Video consumption patterns vary and different content may be relevant to different platforms.
But the overall lesson is clear: “TV” is not just the big screen in the corner of the living room. It must embrace multiscreen distribution strategies in order to reach its maximum potential. TV companies are betraying their audiences and their investors if they don’t target the 6.4bn addressable screens available to them.
2014 H1 changes on the Worldwide Tablet market
Versus as it was presented in The lost U.S. grip on the mobile computing market, including not only the device business, but software development and patterns of use in general [this same blog, April 14, 2014]:
 Source: The Tablet Market Ticks Up In The Second Quarter
With White Box Shipments Leading The Way [Business Insider, July 25, 2014]
-
The global tablet market ticked up in the second quarter of 2014, although growth is still near the market’s historical low.
- Shipments hit about 44.3 million during the period, yielding year-over-year growth of 11%.
While an improvement from the previous quarter, consider that the tablet market had year-over-year growth of nearly 80% in the same quarter just a year ago.
- Although it lead all vendors with about 27% market share, Apple’s iPad shipments declined 9% year-over-year during the period. That marks the second consecutive quarter in which iPad shipments have declined.
- Samsung’s tablet shipments grew a paltry 1% for the period to hit 8.5 million units in the second quarter. That is an enormous slowdown compared to the growth rates it was achieving just a year ago. In the second quarter of 2013, Samsung tablet shipments grew 300% year-over-year.
- Both Apple and Samsung lost market share during the quarter. Apple’s leading market share fell from 33% to 27% while Samsung’s dipped two percentage points to 17%.
- “White-box” vendors = 41% of market


Worldwide Tablet Market Grows 11% in Second Quarter on Shipments from a Wide Range of Vendors, According to IDC [IDC press release, July 24, 2014]
The worldwide tablet grew 11.0% year over year in the second quarter of 2014 (2Q14) with shipments reaching 49.3 million units according to preliminary data from the International Data Corporation (IDC) Worldwide Quarterly Tablet Tracker. Although shipments declined sequentially from 1Q14 by -1.5%, IDC believes the market will experience positive but slower growth in 2014 compared to the previous year.
“As we indicated last quarter, the market is still being impacted by the rise of large-screen smartphones and longer than anticipated ownership cycles,” said Jean Philippe Bouchard, IDC Research Director for Tablets. “We can also attribute the market deceleration to slow commercial adoption of tablets. Despite this trend, we believe that stronger commercial demand for tablets in the second half of 2014 will help the market grow and that we will see more enterprise-specific offerings, as illustrated by the Apple and IBM partnership, come to market.”
Despite declining shipments of its iPad product line, Apple managed to maintain its lead in the worldwide tablet market, shipping 13.3 million units in the second quarter. Following a strong first quarter, Samsung struggled to maintain its momentum and saw its market share slip to 17.2% in the second quarter. Lenovo continued to climb the rankings ladder, surpassing ASUS and moving into the third spot in the tablet market, shipping 2.4 million units and grabbing 4.9% markets share. The top 5 was rounded out by ASUS and Acer, with 4.6% and 2.0% share, respectively. Share outside the top 5 grew to an all time high as more and more vendors have made inroads in the tablet space. By now most traditional PC and phone vendors have at least one tablet model in the market, and strategies to move bundled devices and promotional offerings have slowly gained momentum.
“Until recently, Apple, and to a lesser extent Samsung, have been sitting at the top of the market, minimally impacted by the progress from competitors,” said Jitesh Ubrani, Research Analyst, Worldwide Quarterly Tablet Tracker. “Now we are seeing growth amongst the smaller vendors and a levelling of shares across more vendors as the market enters a new phase.”
Worldwide Tablet Shipments Miss Targets as First Quarter Experiences Single-Digit Growth, According to IDC [IDC press release, May 1, 2014]
Worldwide tablet plus 2-in-1 shipments slipped to 50.4 million units in the first calendar quarter of 2014 (1Q14) according to preliminary data from the International Data Corporation (IDC) Worldwide Quarterly Tablet Tracker. The total represents a sequential decline of -35.7% from the high-volume holiday quarter and just 3.9% growth over the same period a year ago. The slowdown was felt across operating systems and screen sizes and likely points to an even more challenging year ahead for the category.
“The rise of large-screen phones and consumers who are holding on to their existing tablets for ever longer periods of time were both contributing factors to a weaker-than-anticipated quarter for tablets and 2-in-1s,” said Tom Mainelli, IDC Program Vice President, Devices and Displays. “In addition, commercial growth has not been robust enough to offset the slowing of consumer shipments.”
Apple maintained its lead in the worldwide tablet plus 2-in-1 market, shipping 16.4 million units. That’s down from 26.0 million units in the previous quarter and well below its total of 19.5 million units in the first quarter of 2013. Despite the contraction, the company saw its share of the market slip only modestly to 32.5%, down from the previous quarter’s share of 33.2%. Samsung once again grew its worldwide share, increasing from 17.2% last quarter to 22.3% this quarter. Samsung continues to work aggressively with carriers to drive tablet shipments through attractively priced smartphone bundles. Rounding out the top five were ASUS (5%), Lenovo (4.1%), and Amazon (1.9%).
“With roughly two-thirds share, Android continues to dominate the market,” said Jitesh Ubrani, Research Analyst, Worldwide Quarterly Tablet Tracker. “Although its share of the market remains small, Windows devices continue to gain traction thanks to sleeper hits like the Asus T100, whose low cost and 2-in-1 form factor appeal to those looking for something that’s ‘good enough’.”
Digitimes Research: Global tablet shipments reach 55.06 million units in 2Q14 [press release, July 23, 2014]
There were 55.06 million tablets shipped globally in the second quarter of 2014, decreasing 4.5% on quarter but increasing 17.9% on year, according to Digitimes Research.
The shipments consisted of 14.1 million iPads, down 10% on quarter, and 18.96 million units launched by vendors other than Apple, down 12.7% on quarter. Additionaly, 22.3 million white-box units were shipped in the second quarter.
Shipments of small-size Wi-Fi-enabled units in particular slowed down in the second quarter and the time period was also a slow season for shipments. Supply chains also faced yield issues and Samsung saw less-than-expected shipments for its 8-inch tablets. Tablets sized 10-inch and above have seen shipment increases since fourth-quarter 2014.
Taiwan tablet makers meanwhile surpassed 20 million in shipments for brand tablets during the second quarter, which made up 60% of overall brand tablet shipments during the time period, added Digitimes Research.
Digitimes Research: Global tablet shipments drop 30% sequentially in 1Q14 [press release, April 23, 2014]
Global tablet shipments reached only 58.56 million units in the first quarter of 2014, down almost 30% sequentially, but up 4.6% on year despite Samsung Electronics trying to boost both its high-end and entry-level tablet shipments and Lenovo pushing shipments to meet its fiscal 2013 targets. Seasonality, Apple seeing weaker sales, and the tablet market growing mature were also factors that affected shipment performance, according to Digitimes Research.
Shipments of iPads suffered both on-year and sequential drops to reach 15.85 million units in the first quarter. Non-iPad tablet shipments were 22.31 million units, down 20% sequentially, but up over 30% on year thanks to strong demand for Samsung, Lenovo and Asustek’s Windows-based models. White-box tablet shipments reached only 20.4 million units due to seasonality and labor shortages during the Lunar New Year holidays.
Apple and Samsung remained the top-two vendors in the first quarter, but the two players’ market share gap was less than 6pp. Lenovo was the third-largest vendor, followed closely by Asustek Computer in fourth. Amazon and Google dropped to number seven and ten.
Taiwan ODMs shipped 22.15 million tablets together in the first quarter, accounting for less than 60% of global shipments. The largest maker, Foxconn Electronics (Hon Hai Precision Industry), and second-largest Pegatron Technology both suffered significant shipment drops due to lower-than-expected demand for iPad. Quanta saw increased shipments in the quarter because of Asustek’s T100 tablet, and returned to being the third-largest maker in Taiwan. Compal Electronics’ shipments suffered a sharp decline because Amazon’s Kindle Fire range is approaching the end of its lifecycle, while Acer is turning to cooperate with China-based makers, Digitimes Research‘s figures showed.
Digitimes Research: Global white-box tablet shipments down in 1Q14 [press release, May 12, 2014]
There were 20.4 million white-box tablets shipped globally in the first quarter of 2014, decreasing by 27.4% on quarter and by 2.4% on year, according to Digitimes Research.
The decrease in shipments was mainly because most white-box vendors are based in China and there were fewer working days in the first quarter due to the Lunar New Year holidays, Digitimes Research pointed out.
Of the shipments, 7-inch models accounted for 70.5%, 7.85/7.9-inch ones 21.3%, 8- to 9-inch ones 4.2%, above 9- to 10-inch 2.9%, above 10-inch 1.1%.
Due to strong demand in emerging markets including India, Indonesia, Thailand, Russia and Eastern Europe, global white-box tablet shipments in the second quarter of 2014 will increase 14.2% on quarter and 45.6% on year to 23.3 million units.
2014 H1 changes on the Consumer Tablet Market in China
 Versus as it was presented in Section I. of The lost U.S. grip on the mobile computing market, including not only the device business, but software development and patterns of use in general [this same blog, April 14, 2014]


Justin Rosenstein of Asana: Be happy in a project-oriented teamwork environment made free of e-mail based communication hassle
Get Organized: Using Asana in Business [PCMag YouTube channel, Febr 24, 2014]
Steven Sinofsky, former head of Microsoft Office and (later) Windows at Microsoft:
We’ve all seen examples of the collaborative process playing out poorly by using email. There’s too much email and no ability to track and manage the overall work using the tool. Despite calls to ban the process, what is really needed is a new tool. So Asana is one of many companies working to build tools that are better suited to the work than one we currently all collectively seem to complain about.
in Don’t ban email—change how you work! [Learning by Shipping, Jan 31, 2014]
Asana is a simple example of an easy-to-use and modern tool that decreases (to zero) email flow, allows for everyone to contribute and align on what needs to be done, and to have a global view of what is left to do.
in You’re doing it wrong [Learning by Shipping, April 10, 2014] and Shipping is a Feature: Some Guiding Principles for People That Build Things [Learning by Shipping, April 17, 2014]

Making e-mail communication easier [Fox Business Video]
May. 06, 2014 – 3:22 – Asana co-founder Justin Rosenstein weighs in on his new email business.
How To Collaborate Effectively With Asana [Forbes YouTube channel, Feb 26, 2013]
Dustin Moskovitz: How Asana Gets Work Done [Forbes YouTube channel, Feb 26, 2013]
Do Great Things: Keynote by Justin Rosenstein of Asana | Disrupt NY 2014 [TechCrunch YouTube channel, May 5, 2014]
Asana’s Justin Rosenstein: “I Flew Coach Here.” | Disrupt NY 2014 [TechCrunch YouTube channel, May 5, 2014]
How we use Asana [asana blog, Oct 9, 2013]
We love to push the boundaries of what Asana can do. From creating meeting agendas to tracking bugs to maintaining snacks in the refrigerator, the Asana product is (unsurprisingly) integral to everything we do at Asana. We find many customers are also pushing the boundaries of Asana to fit their teams’ needs and processes. Since Asana was created to be flexible and powerful enough for every team, nothing makes us more excited than hearing about these unique use cases.
Recently, we invited some of our Bay Area-based customers to our San Francisco HQ to share best practices with one another and hear from our cofounder Justin Rosenstein about the ways we use Asana at Asana. We’re excited to pass on this knowledge through some video highlights from the event. You can watch the entire video here: The Asana Way to Coordinate Ambitious Projects with Less Effort
Capture steps in a Project
“The first thing we always do is create a Project that names what we’re trying to accomplish. Then we’ll get together as a team and think of, ‘What is every single thing we need to accomplish between now and the completion of that Project?’ Over the course of the Project, all of the Tasks end up getting assigned.”Organize yourself
“Typically when I start my day, I’ll start by looking at all the things that are assigned to me. I’ll choose a few that I want to work on today. I try to be as realistic as possible, which means adding half as many things as I am tempted to add. After putting those into my ‘Today’ view, there are often a couple of other things I need to do. I just hit enter and add a few more tasks.”Forward emails to Asana
“Because I want Asana to be the source of truth for everything I do, I want to put emails into my task list and prioritize them. I’ll just take the email and forward it to x@mail.asana.com. We chose ‘x’ so it wouldn’t conflict with anything else in your address book. Once I send that, it will show up in Asana with the attachments and everything right intact.”Run great meetings
“We maintain one Project per meeting. If I’m looking at my Task list and see a Task I want to discuss at the meeting, I’ll just use Quick Add (tab + Q) to put the Task into the correct Project. Then when the meeting comes around, everything that everyone wants to talk about has already been constructed ahead of time.”Track responsibility
“Often a problem comes up and someone asks, ‘Who’s responsible for that?’ So instead, we’ve built out a list of areas of responsibility (AoRs), which is all the things that someone at the company has to be responsible for. By having AoRs, we distribute responsibility. We can allow managers to focus on things that are more specific to management and empower everyone at the company to be a leader in their own field.”
Background on https://asana.com/
|
Asana |
About Us |
|
Connect |
Support |
How it all started and progressed?
asana demo & vision talk [Robert Marquardt YouTube channel, Feb 15, 2011]
The Asana Vision & Demo [asana blog, Feb 7, 2011]
We recently hosted an open house at our offices in San Francisco, where we showed the first public demo of Asana and deep-dived into the nuances of the product, the long-term mission that drives us, how the beta’s going, and more. We were really excited to be able to share what we’ve been working on and why we’re so passionate about it, and hope you enjoy
thisthe above video of the talk:Asana will be available more broadly later this year. In the meantime,
- if you’re interested in participating in the beta program, sign up here.
- if these sound like problems you’d like to help tackle, we’re hiring.
- and if you’d just like to receive updates about Asana going forward, use the form in the upper right of this page.
Introducing Asana: The Modern Way to Work Together [asana blog, Nov 2, 2011]
…
Asana is a modern web application that keeps teams in sync, a shared task list where everyone can capture, organize, track, and communicate what they are working on in service of their common goal. Rather than trying to stay organized through the tedious grind of emails and meetings, teams using Asana can move faster and do more — or even take on bigger and more interesting goals.
…How Asana Works:
Asana re-imagines the way we work together by putting the fundamental unit of productivity – the task – at the center. Breaking down ambitious goals into small pieces, assigning ownership of those tasks, and tracking them to completion is how things get built, from software to skyscrapers. With Asana, you can:
- capture everything your team is planning and doing in one place. When tasks and the conversations about them are collected together, instead of spread around emails, documents, whiteboards, and notebooks, they become the shared, trusted, collective memory for your organization.
- keep your team in sync on the priorities, and what everyone is working on. When you have a single shared view of a project’s priorities, along with an accurate view into what each person is working on and when, everyone on the team knows exactly what matters, and what work remains between here and the goal.
- get the right information at the right time. Follow tasks, and you’ll receive emails as their status evolves. Search, and you’ll see the full activity feed of all the discussions and changes to a task over its history. Now, it’s easy to stay on top of the details — without asking people to forward you a bunch of email threads.
…
Building tools for teamwork [asana blog, Nov 22, 2013]
Our co-founder, Justin, recently wrote in Wired about why we need to rethink the tools we use to work together. The article generated a lot of interesting comments, from ideas on knowledge management to fatigue with the “meeting lifestyle,” to this protest on the typical office culture:
“Isn’t the root of this problem that, within our own organizations, we fiercely guard information and our decision-making processes? Email exchanges and invite-only meetings shut out others– forcing the need for follow-up conversations, summary reports, and a trail of other status/staff meetings to relay content already covered some place/some time before.”
To reach its goals, we think a team needs clarity of purpose, plan and responsibility. Technology and tools can help us reach that kind of clarity, but only if they target the right problem. From their roles at Facebook, Asana’s founders have extensive knowledge of social networks, and the social graph technology they rely on. But Asana isn’t a social network. Why? Because, as Justin outlines, the social graph doesn’t target the problem of work:
Our personal and professional lives, even if they overlap, have two distinct goals — and they require different “graphs.”
For our personal lives, the goal is love (authentic interpersonal connection), and that requires a social graph with people at the center. For our work lives, the goal is creation (working together to realize our collective potential), and that requires a work graph, with the work at the center.
Don’t get me wrong: Human connection is valuable within a business. But it should be in service to the organizational function of getting work done, and doesn’t need to be the center of the graph.
So, how does this change the experience for you and your teammates? A work graph means having all the information you need when you need it. Instead of blasting messages at the whole team, like “Hey, has anyone started working on this yet?”, you should be able to efficiently find out exactly who’s working on that task and how much progress they’ve made. That’s the target Asana is aiming for. Read Justin’s full Wired article.

Organizations in Asana [asana blog, May 1, 2013]
Today, we’re excited to be launching a collection of new features aimed at helping companies use and support Asana across their entire enterprise. We call it Organizations.
Since we began, Asana has been on a mission to help great teams achieve more ambitious goals. We started 18 months ago with our free service, targeted at smaller teams and even individuals – helping them get and stay organized.
When we launched our first premium tiers six months later, we enabled medium sized teams and companies – think 10s to 100s of people – to go further with Asana. In the year between then and now, we’ve been continuously amazed by all the places and ways Asana is being used to organize a team: in industries as diverse as education, healthcare, finance, technology, and manufacturing; in companies from two-person partnerships to Fortune 100 enterprises; and in dozens of countries representing every continent but the frozen one. There’s a lot of important work being organized in Asana.
But we’re still just getting started – there remain teams that we haven’t been ready to support: the largest teams, those that grow from 100s to 1,000s of people. While it would be remarkable if it only took a small number of coworkers to design and manufacture electric cars, synthesize DNA, or deliver healthcare to villages across the globe – these missions are complex, and require more people to be involved in them to succeed. Many of the teams using Asana today are inside these bigger organizations, and they’ve been asking for Asana to work at enterprise-scale. So for the past several months, we’ve been working on just that.
…
Stories from our first year [asana blog, Nov 12, 2012]
… When we launched a year go, we had an ambitious mission: to create a shared task management platform that empowers teams of like-minded people to do great things. … In the course of our first year, tens of thousands of teams looking for a better way to work together have adopted Asana. …
… we collected three of these stories from three distinct kinds of teams:
– a tech startup [Foursquare],
– a fast-growing organic food company [Bare Fruit & Sundia] and
– a leading Pacific Coast aquarium [Aquarium of the Bay].…
Foursquare Launches 5.0
Right around the time Foursquare passed 100 employees over the last year, we started building Foursquare 5.0. This update was a big deal: we were overhauling Foursquare’s core mechanics, evolving from check-ins towards the spontaneous discovery of local businesses. As we built the new app, we needed a way to gather feedback from the entire team.
We tried what felt like every collaboration tool around. Group emails were a mess. Google Docs was impossible to parse. We’d heard about Asana and decided to give it a shot.
Using Asana, we were easily able to collect product feedback and bugs from everyone in the company, then parse, discuss, distribute and prioritize the work. It became an indispensable group communication tool.
Foursquare 5.0 was a giant success, and we couldn’t have done it without Asana.
–Noah Weiss, Product Manager

…
Then, Of Course, There Is Us
It’s an understatement to say that we rely on Asana. We use our own product to manage every function of our business. Asana is where we plan, capture ideas, build meeting agendas, prioritize our product roadmap, document which bugs to fix and list the snacks to buy. It’s our CRM, our editorial calendar, our Applicant Tracking System, and our new-hire orientation system. Every team in the company – from product, design, and engineering to sales and marketing to recruiting and user operations – relies on the product we are building to stay in sync, connect our individual tasks to the bigger picture and accomplish our collective goals.
…
Q&A: Rising Realty Partners builds their business with Asana [asana blog, Feb 7, 2014]
…The Los Angeles development firm Rising Realty Partners, shared with us how they used Asana, and our integration with Dropbox, to close a massive ten-property deal.
As our business expanded, we found ourselves relying heavily on email, faxes, and even FedEx to communicate with each other and collaborate with outside parties. We needed a better way to organize, prioritize and communicate around our work, and we found the answer in Asana.
…
I can’t image how complex our communications would have been if we weren’t using Asana. We had dozens of people internally, and more than 50 people externally, all involved in making this deal happen. Having all of that communication in Asana significantly cut down on the craziness.
…
Because of Asana’s Dropbox integration, our workflow is now fast, intuitive and organized — something that was impossible to achieve over email. For the acquisition, we used Asana and Dropbox simultaneously to keep track of everything; from what each team member was doing, to the current status of each transaction, to keeping a history of all related documents. We had more than 18,000 items in Dropbox that we would link to in Asana instead of attaching them in email. We removed more than 30 gigabytes of information per recipient from our inboxes and everything was neatly organized around the work we were doing in Asana. This meant that the whole team always had the latest and most relevant information.
…For this entire project, maybe one percent of our total internal communication was happening in email. With Asana, anyone in the company could look at any aspect of the project, see where it stood, and add their input. No one had to remember to cc’ or ‘reply all’.
….
The success of this deal was largely due to Asana and we plan to use it in future acquisitions –Asana has become essential to our team’s success.
….
Our iPhone App Levels Up [asana blog, Sept 6, 2012]
Until recently, we’ve focused most of our energy on the browser-based version of Asana. But, in the last few months, even as we’ve launched major new features in our web application, we’ve been putting much more time into improving the mobile experience. In June, we made several meaningful architectural improvements to pave the way for bigger and better things and hinted that these changes were in the works.
Today, we’ve taken the next step in that direction: Version 2.0 of our iPhone app is in the App Store now. We are really proud of this effort – almost everyone at Asana played a part in this release. This new version is a top-to-bottom redesign that really puts the power of the desktop web version of Asana right in your pocket.
…
Asana comes to Android [asana blog, Feb 28, 2013]
Five months ago, we launched our first bonafide mobile app, for the iPhone, and we’ve been steadily improving it ever since. Focusing on a single platform at first allowed us to be meticulous about our mobile experience, adding new features and honing the design until we knew it was something people loved. After strong positive feedback from our customers and a solid rating in the iTunes App Store, we knew it was time.
Today, we are happy to announce that Asana for Android is here. You can get it right now in the Google Play store
…
As of today (May 8, 2014) there are 70 employees and 15 open positions. The company has 4 investors: Benchmark Capital, Andreessen-Horowitz, Founders Fund and Peter Thiel. The first two put $9 million in November 2009. Then Founders Fund and Peter Thiel added to that $28 million in July 2012. Reuters reported that with Facebook alumni line up $28 million for workplace app Asana [July 23, 2012]:
Asana, a Silicon Valley start-up, has lined up $28 million in a financing round led by PayPal co-founder Peter Thiel and his Founders Fund, the company said.
The funding round values the workplace-collaboration company at $280 million, a person familiar with the matter said.
“This investment allows us to attract the best and brightest designers and engineers,” said Asana co-founder Justin Rosenstein, who said that in turn would help the company build on its goal of making interaction among its client-companies’ employees easier.
Asana launched the free version last year of its company management software that makes it easier to collaborate on projects. It introduced a paid, premium service earlier this year. It declined to give revenue figures, but said “hundreds” of customers had upgraded to the premium version.
Although Rosenstein and co-founder Dustin Moskovitz are alumni of social-network Facebook– Moskovitz co-founded the service with his Harvard roommate Mark Zuckerberg – they were quick to distance Asana from social networking.
Instead, they say, they view the company as an alternative to email, in-person meetings, physical whiteboards, and spreadsheets.
“That’s what we see as our competition,” said Rosenstein. “Replacing those technologies.”
With its latest funding round, Asana has now raised a total of $38 million from investors including Benchmark Capital and Andreessen Horowitz.
Thiel, who got to know Moskovitz and Rosenstein thanks to his early backing of Facebook, had already invested in Asana when it raised its “angel” round in early 2009. Now, his high-profile Founders Fund is investing and Thiel is joining Asana’s board.
Facebook has 901 million monthly users and revenue last year of $3.7 billion. But its May initial public offering disappointed many investors after it priced at $38 per share and then quickly fell. It closed on Friday at $28.76.
Many investors speculate that start-ups will have to accept lower valuations in the wake of the Facebook IPO. The Asana co-founders said the terms of their latest funding round were set before Facebook debuted on public markets.
A few of Facebook’s longtime employees have gone on to work on their own ventures.
Bret Taylor, formerly chief technology officer, said last month he was leaving to start his own company.
Dave Morin, who joined Facebook in 2008 from Apple, left in 2010 to found social network Path. Facebook alumni Adam D’Angelo and Charlie Cheever left in 2009 to start Quora, their question-and-answer company, which is also backed by Thiel.
Another former roommate of Zuckerberg’s, Chris Hughes, also left a few years ago and coordinated online organizing for Barack Obama’s 2008 presidential campaign. Now, he is publisher of the New Republic magazine.
Matt Cohler, who joined Facebook from LinkedIn early in 2005, joined venture capital firm Benchmark Capital in 2008. His investments there include Asana and Quora.
Core technology used
Luna, our in-house framework for writing great web apps really quickly [asana blog, Feb 2, 2010]
At Asana, we’re building a Collaborative Information Manager that we believe will make it radically easier for groups of people to get work done. Writing a complex web application, we experienced pain all too familiar to authors of “Web 2.0″ software (and interactive software in general): there were all kinds of extremely difficult programming tasks that we were doing over and over again for every feature we wanted to write. So we’re developing Lunascript — an in-house programming language for writing rich web applications in about 10% of the time and code you can today.
Check out the
videowe made »
[rather an article about Luna as of Nov 2, 2011]
Update: For now we’ve tabled using the custom DSL syntax in favor of a set of Javascript idioms and conventions on top of the “Luna” runtime. So while the contents of this post still accurately present the motivation and capabilities of the Luna framework, we’re using a slightly more cumbersome (JavaScript) syntax than what you see below, in exchange for having more control over the “object code” (primarily for hand-tuning performance).
Release the Kraken! An open-source pub/sub server for the real-time web [asana blog, March 5, 2013]
Today, we are releasing Kraken, the distributed pub/sub server we wrote to handle the performance and scalability demands of real-time web apps like Asana.
…
Before building Kraken, we searched for an existing open-source pub/sub solution that would satisfy our needs. At the time, we discovered that most solutions in this space were designed to solve a much wider set of problems than we had, and yet none were particularly well-suited to solve the specific requirements of real-time apps like Asana. Our team had experience writing routing-based infrastructure and ultimately decided to build a custom service that did exactly what we needed – and nothing more.The decision to build Kraken paid off. For the last three years, Kraken has been fearlessly routing messages between our servers to keep your team in sync. During this time, it has yet to crash even once. We’re excited to finally release Kraken to the community!
Issues Moving to Amazon’s Elastic Load Balancer [asana blog, June 5, 2012]
…
Asana’s infrastructure runs almost entirely on top of Amazon Web Services (AWS). AWS provides us with the ability to launch managed production infrastructure in minutes with simple API calls. We use AWS for servers, databases, monitoring, and more. In general, we’ve been very happy with AWS. A month ago, we decided to use Amazon’s Elastic Load Balancer service to balance traffic between our own software load balancers.
…
Announcing the Asana API [asana blog, April 19, 2012]
Today we are excited to share that you can now add and access Asana data programmatically using our simple REST API.
The Asana API lets you build a variety of applications and scripts to integrate Asana with your business systems, show Asana data in other contexts, and create tasks from various locations.
Here are some examples of the things you can build:
- Source Control Integration to mark a Task as complete and add a link to the code submission as a comment when submitting code.
- A desktop app that shows the Tasks assigned to you
- A dashboard page that shows a visual representation of complete and incomplete Tasks in a project
…
Asana comes to Internet Explorer [asana blog, Oct 16, 2013]
…
Asana is a fast and versatile web-based application that pushes the boundaries of what’s possible inside a browser. Our sophisticated Javascript app requires a modern browser platform, and up until now we could only provide the right user experience on Chrome, Firefox, and Safari. With IE10, Internet Explorer has drastically improved their developer tools and made a marked improvement in standards compliance. With these improvements, we were able to confidently develop Asana for IE10, and we’ve been pleasantly surprised by the process. Check out the blog post on our developer site to see what we learned during this project.
…
Microsoft BUILD 2014 Day 2: “rebranding” to Microsoft Azure and moving toward a comprehensive set of fully-integrated backend services
- “Rebranding” into Microsoft Azure from the previous Windows Azure
- Microsoft Azure Momentum on the Market
- The new Azure Management Portal (preview)
- New Azure features: IaaS, web, mobile and data announcements
Microsoft Announces New Features for Cloud Computing Service [CCTV America YouTube channel, April 3, 2014]
Day two of the Microsoft Build developer conference in San Francisco wrapped up with the company announcing 44 new services. Most of those are based on Microsoft Azure – it’s cloud computing platform that manages applications across data centers. CCTV’s Mark Niu reports from San Francisco.
Watch the first 10 minutes of this presentation for a brief summary of the latest state of Microsoft Azure: #ChefConf 2014: Mark Russinovich, “Microsoft Azure Group” [Chef YouTube channel, April 16, 2014]
Then here is a fast talk and Q&A on Azure with Scott Guthrie after his keynote preseantation at BUILD 2014:
Cloud Cover Live – Ask the Gu! [jlongo62 YouTube channel, published on April 21, 2014]
The original: Cloud Cover Live – Ask the Gu! [Channel 9, April 3, 2014]
Details:
- “Rebranding” into Microsoft Azure from the previous Windows Azure
- Microsoft Azure Momentum on the Market
- The new Azure Management Portal (preview)
- New Azure features: IaaS, web, mobile and data announcements
[2:45:47] long video record of the Microsoft Build Conference 2014 Day 2 Keynote [MSFT Technology News YouTube channel, recorded on April 3, published on April 7, 2014]
The original video record on Channel 9
Day 2 Keynote transcript by Microsoft
1. “Rebranding” into Microsoft Azure from the previous Windows Azure
Yes, you’ve noticed right: the Windows prefix has gone, and the full name is now only Microsoft Azure! The change happened on April 3 as evidenced by change of the cover photo on the Facebook site, now also called Microsoft Azure:

from this cover photo used from July 23, 2013 on:

And it happened without any announcement or explanation as even the last, April 1 Microsoft video carried the Windows prefix: Tuesdays with Corey //build Edition
as well as the last, March 14 video ad: Get Your Big Bad Wolf On (Extended)
2. Microsoft Azure Momentum on the Market
The day began with Scott Guthrie, Executive Vice President, Microsoft Cloud and Enterprise group, touting Microsoft progress with Azure for the last 18 months when:
… we talked about our new strategy with Azure and our new approach, a strategy that enables me to use both infrastructure as a service and platform as a service capabilities together, a strategy that enables developers to use the best of the Windows ecosystem and the best of the Linux ecosystem together, and one that delivers unparalleled developer productivity and enables you to build great applications and services that work with every device …
- Last year … shipped more than 300 significant new features and releases
- … we’ve also been hard at work expanding the footprint of Azure around the world. The green circles you see on the slide here represent Azure regions, which are clusters of datacenters close together, and where you can go ahead and run your application code. Just last week, we opened two new regions, one in Shanghai and one in Beijing. Today, we’re the only global, major cloud provider that operates in mainland China. And by the end of the year, we’ll have more than 16 public regions available around the world, enabling you to run your applications closer to your customers than ever before.
- More than 57 percent of the Fortune 500 companies are now deployed on Azure.
- Customers run more than 250,000 public-facing websites on Azure, and we now host more than 1 million SQL databases on Azure.
- More than 20 trillion objects are now stored in the Azure storage system. We have more than 300 million users, many of them — most of them, actually, enterprise users, registered with Azure Active Directory, and we process now more than 13 billion authentications per week.
- We have now more than 1 million developers registered with our Visual Studio Online service, which is a new service we launched just last November.
Let’s go beyond the big numbers, though, and look at some of the great experiences that have recently launched and are using the full power of Azure and the cloud.
“Titanfall” was one of the most eagerly anticipated games of the year, and had a very successful launch a few weeks ago. “Titanfall” delivers an unparalleled multiplayer gaming experience, powered using Azure.
Let’s see a video of it in action, and hear what the developers who built it have to say.
[Titanfall and the Power of the Cloud [xbox YouTube channel, April 3, 2014]]
One of the key bets the developers of “Titanfall” made was for all game sessions on the cloud. In fact, you can’t play the game without the cloud, and that bet really paid off.
As you heard in the video, it enables much, much richer gaming experiences. Much richer AI experiences. And the ability to tune and adapt the game as more users use it.
To give you a taste of the scale, “Titanfall” had more than 100,000 virtual machines deployed and running on Azure on launch day. Which is sort of an unparalleled size in terms of a game launch experience, and the reviews of the game have been absolutely phenomenal.
Another amazing experience that recently launched and was powered using Azure was the Sochi Olympics delivered by NBC Sports.
NBC used Azure to stream all of the games both live and on demand to both Web and mobile devices. This was the first large-scale live event that was delivered entirely in the cloud with all of the streaming and encoding happening using Azure.
Traditionally, with live encoding, you typically run in an on-premises environment because it’s so latency dependent. With the Sochi Olympics, Azure enabled NBC to not only live encode in the cloud, but also do it across multiple Azure regions to deliver high-availability redundancy.
More than 100 million people watched the online experience, and more than 2.1 million viewers alone watched it concurrently during the U.S. versus Canada men’s hockey match, a new world record for online HD streaming.
…
RICK CORDELLA [Senior Vice President and General Manager of NBC Sports Digital]: The company bets about $1 billion on the Olympics each time it goes off. And we have 17 days to recoup that investment. Needless to say, there is no safety net when it comes to putting this content out there for America to enjoy. We need to make sure that content is out there, that it’s quality, that our advertisers and advertisements are being delivered to it. There really is no going back if something goes wrong.
…
The decision for that was taken more than a year ago: Windows Azure Teams Up With NBC Sports Group [Microsoft Azure YouTube channel, April 9, 2013]
3. The new Azure Management Portal (preview)
But in fact a new way of providing a comprehensive set of fully-integrated backend services had significantly bigger impact on the audience of developers. According to Microsoft announces new cloud experience and tools to deliver the cloud without complexity [The Official Microsoft Blog, April 3, 2014]
The following post is from Scott Guthrie, Executive Vice President, Cloud and Enterprise Group, Microsoft.
On Thursday at Build in San Francisco, we took an important step by unveiling a first-of-its kind cloud environment within Microsoft Azure that provides a fully integrated cloud experience – bringing together cross-platform technologies, services and tools that enable developers and businesses to innovate with enterprise-grade scalability at startup speed. Announced today, our new Microsoft Azure Preview [Management]Portal is an important step forward in delivering our promise of the cloud without complexity.
When cloud computing was born, it was hailed as the solution that developers and business had been waiting for – the promise of a quick and easy way to get more from your business-critical apps without the hassle and cost of infrastructure. But as the industry transitions toward mobile-first, cloud-first business models and scenarios, the promise of “quick and easy” is now at stake. There’s no question that developing for a world that is both mobile-first and cloud-first is complicated. Developers are managing thousands of virtual machines, cobbling together management and automation solutions, and working in unfamiliar environments just to make their apps work in the cloud – driving down productivity as a result.
Many cloud vendors tout the ease and cost savings of the cloud, but they leave customers without the tools or capabilities to navigate the complex realities of cloud computing. That’s why today we are continuing down a path of rapid innovation. In addition to our groundbreaking new Microsoft Azure Preview [Management] Portal, we announced several enhancements our customers need to fully tap into the power of the cloud. These include:
- Dozens of enhancements to our Azure services across Web, mobile, data and our infrastructure services
- Further commitment to building the most open and flexible cloud with Azure support for automation software from Puppet Labs and Chef.
- We’ve removed the throttle off our Application Insights preview, making it easier for all developers to build, manage and iterate on their apps in the cloud with seamless integration into the IDE

<For details see the separate section 4. New Azure features: IaaS, web, mobile and data announcements>
Here is a brief presentation by a Brazilian specialist: Microsoft Azure [Management] Portal First Touch [Bruno Vieira YouTube channel, April 3, 2014]
From Microsoft evolves the cloud experience for customers [press release, April 3, 2014]
… Thursday at Build 2014, Microsoft Corp. announced a first-of-its-kind cloud experience that brings together cross-platform technologies, services and tools, enabling developers and businesses to innovate at startup speed via a new Microsoft Azure Preview [Management] Portal.
In addition, the company announced several new milestones in Visual Studio Online and .NET that give developers access to the most complete platform and tools for building in the cloud. Thursday’s announcements are part of Microsoft’s broader vision to erase the boundaries of cloud development and operational management for customers.
“Developing for a mobile-first, cloud-first world is complicated, and Microsoft is working to simplify this world without sacrificing speed, choice, cost or quality,” said Scott Guthrie, executive vice president at Microsoft. “Imagine a world where infrastructure and platform services blend together in one seamless experience, so developers and IT professionals no longer have to work in disparate environments in the cloud. Microsoft has been rapidly innovating to solve this problem, and we have taken a big step toward that vision today.”
One simplified cloud experience
The new Microsoft Azure Preview [Management] Portal provides a fully integrated experience that will enable customers to develop and manage an application in one place, using the platform and tools of their choice. The new portal combines all the components of a cloud application into a single development and management experience. New components include the following:
Simplified Resource Management. Rather than managing standalone resources such as Microsoft Azure Web Sites, Visual Studio Projects or databases, customers can now create, manage and analyze their entire application as a single resource group in a unified, customized experience, greatly reducing complexity while enabling scale. Today, the new Azure Manager is also being released through the latest Azure SDK for customers to automate their deployment and management from any client or device.
Integrated billing. A new integrated billing experience enables developers and IT pros to take control of their costs and optimize their resources for maximum business advantage.
Gallery. A rich gallery of application and services from Microsoft and the open source community, this integrated marketplace of free and paid services enables customers to leverage the ecosystem to be more agile and productive.
Visual Studio Online. Microsoft announced key enhancements through the Microsoft Azure Preview [Management] Portal, available Thursday. This includes Team Projects supporting greater agility for application lifecycle management and the lightweight editor code-named “Monaco” for modifying and committing Web project code changes without leaving Azure. Also included is Application Insights, an analytics solution that collects telemetry data such as availability, performance and usage information to track an application’s health. Visual Studio integration enables developers to surface this data from new applications with a single click.
…
Building an open cloud ecosystem
Showcasing Microsoft’s commitment to choice and flexibility, the company announced new open source partnerships with Chef and Puppet Labs to run configuration management technologies in Azure Virtual Machines. Using these community-driven technologies, customers will now be able to more easily deploy and configure in the cloud. In addition, today Microsoft announced the release of Java Applications to Microsoft Azure Web Sites, giving Microsoft even broader support for Web applications.
…
From BUILD Day 2: Keynote Summary [by Steve Fox – DPE (MSFT) on MSDN Blogs, April 3, 2014]
….
Bill Staples then came on stage to show off the new Azure [management] portal design and features. Bill walked through a number of the new innovations in the portal, such as improved UX, app insights, “blade” views [the “blade” term is used for the dropdown that allows a drilldown], etc. A screen shot of the new portal is shown below.


Bill also walked through the comprehensive analytics (such as compute and billing) that are now available on the portal. He also walked through “Application Insights,” which is a great way to instrument your code in both the portal and in your code with easy-to-use, pre-defined code snippets. He completed his demo walkthrough by showing the Azure [management] portal as a “NOC” [Network Operations Center] view on a big-screen TV.

…
The above image is at the [1:44:24] point in time of the keynote video record on Channel 9 and it is giving more information if we provide here the part of transcript around it:
BILL STAPLES at [1:43:39]: Now, to conclude the operations part of this demo, I wanted to show you an experience for how the new Azure Portal works on a different device. You’ve seen it on the desktop, but it works equally well on a tablet device, that is really touch friendly. Check it out on your Surface or your iPad, it works great on both devices.
But we’re thinking as well if you’ve got a big-screen TV or a projector lying around your team room, you might want to think about putting the Microsoft Azure portal as your own personal NOC.
In this case, I’ve asked the Office developer team if we could have access to their live site log. So they made me promise, do not hit the stop button or the delete button, which I promised to do.
[1:44:24] This is actually the Office developer log site. And you can see it’s got almost 10 million hits already today running on Azure Websites. So very high traffic.
They’ve customized it to show off the browser usage on their website. Imagine we’re in a team Scrum with the Office developer guys and we check out, you know, how is the website doing? We’ve got some interesting trends here.
In fact, there was a spike of sessions it looks like going on about a week ago. And page views, that’s kind of a small part. It would be nice to know which page it was that spiked a week ago. Let’s go ahead and customize that.
This screen is kind of special because it has touch screen. So I can go ahead and let’s make that automatically expand there. Now we see a bigger view. Wow, that was a really big spike last week. What page was that? We can click into it. We get the full navigation experience, same on the desktop, as well as, oh, look at that. There’s a really popular blog post that happened about a week ago. What was that? Something about announcing Office on the iPad you love. Makes sense, huh? So we can see the Azure Portal in action here as the Office developer team might imagine it. [1:45:44]
The last thing I want to show is the Azure Gallery.

We populated the gallery with all of the first-party Microsoft Azure services, as well as the [services from] great partners that we’ve worked with so far in creating this gallery.

And what you’re seeing right here is just the beginning. We’ve got the core set of DevOps experiences built out, as well as websites, SQL, and MySQL support. But over the coming months, we’ll be integrating all of the developer and IT services in Microsoft as well as the partner services into this experience.
Let me just conclude by reminding us what we’ve seen. We’ve seen a first-of-its-kind experience from Microsoft that fuses our world-class developer services together with Azure to provide an amazing dev-ops experience where you can enjoy the entire lifecycle from development, deployment, operations, gathering analytics, and iterating right here in one experience.
We’ve seen an application-centric experience that brings together all the dev platform and infrastructure services you know and love into one common shell. And we’ve seen a new application model that you can describe declaratively. And through the command line or programmatically, build out services in the cloud with tremendous ease. [1:47:12]
More information on the new Azure [Management] Portal:
- From Visual Studio Online Integration in the Azure [management] portal [by Brian Harry (MSFT) on MSDN Blogs, April 3, 2014]
Today, at Build, we unveiled a new Azure [Management] Portal experience we are building. I want to give you some insights into the work that VS Online team is doing to help with it. I’m not on the Azure team and am no expert on how they’d like to describe to the world, so please take any comments I make here about the new Azure portal as my perspective on it and not necessarily an official one.
Bill Staples first presented to me almost a year ago an idea of creating a new portal experience for Azure designed to be an optimal experience for DevOps. It would provide everything a DevOps team needs to do modern cloud based development. Capabilities to provision dev and test resources, development and collaboration capabilities, build, release and deployment capabilities, application telemetry and management capabilities and more. Pretty quickly it became clear to me that if we could do it, it would be awesome. An incredibly productive and easy way for devs to do soup to nuts app development.
What we demoed today (and made available via http://portal.azure.com”) is the first incarnation of that. My team (the VS Online Team) has worked very hard over the past many months with the Azure team to build the beginnings of the experience we hope to bring to you. It’s very early and it’s nowhere near done but it’s definitely something we’d love to start getting some feedback on.
For now, it’s limited to Azure websites, SQL databases and a subset of the VS Online capabilities. If you are a VS Online/TFS user, think of this as a companion to Visual Studio, Visual Studio Online and all of the tools you are used to. When you create a team project in the Azure portal, it’s a VS Online Team Project like any other and is accessible from the Azure portal, the VS Online web UI, Visual Studio, Eclipse and all the other ways your Visual Studio Online assets are available. For now, though, there are a few limitations – which we are working hard to address. We are in the middle of adding Azure Active Directory support to Visual Studio Online and, for a variety of reasons, chose to limit the new portal to only work with VS Online accounts linked to Azure Active Directory.
The best way to ensure this is just to create a new Team Project and a new VS Online account from within the new Azure portal. You will need to be logged in to the Azure portal with an identity known to your Azure Active Directory tenant and to add new users, rather than add them directly in Visual Studio Online, you will add them through Azure Active directory. One of the ramifications of this, for now, is that you can’t use an existing VS Online account in the new portal – you must create a new one. Clearly that’s a big limitation and one we are working hard to remove. We will enable you to link existing VS Online accounts to Active Directory we just don’t have it yet – stay tuned.
I’ll do a very simple tour. You can also watch Brian Keller’s Channel9 video.
…
- Enabling DevOps with Azure and Visual Studio Online [jlongo62 YouTube channel, published on April 21, 2014]
Further information:
- Building your Dream DevOps Dashboard with the new Azure Preview Portal [by Brian Keller [MSFT] on MSDN Blogs, April 10, 2014]
- Azure [Management] Portal Preview and Visual Studio Online: Adding a user [by Buck Hodges (MSFT) on MSDN Blogs, April 3, 2014]
4. New Azure features: IaaS, web, mobile and data announcements
According to Scott Guthrie, Executive Vice President, Microsoft Cloud and Enterprise group:

[IaaS] First up, let’s look at some of the improvements we’re making with our infrastructure features and some of the great things we’re enabling with virtual machines.
Azure enables you to run both Windows and Linux virtual machines in the cloud. You can run them as stand-alone servers, or join them together to a virtual network, including one that you can optionally bridge to an on-premises networking environment.
This week, we’re making it even easier for developers to create and manage virtual machines in Visual Studio without having to leave the VS IDE: You can now create, destroy, manage and debug any number of VMs in the cloud. (Applause.)
Prior to today, it was possible to create reusable VM image templates, but you had to write scripts and manually attach things like storage drives to them. Today, we’re releasing support that makes it super-easy to capture images that can contain any number of storage drives. Once you have this image, you can then very easily take it and create any number of VM instances from it, really fast, and really easy. (Applause.)
Starting today, you can also now easily configure VM images using popular frameworks like Puppet, Chef, and our own PowerShell and VSD tools. These tools enable you to avoid having to create and manage lots of separate VM images. Instead, you can define common settings and functionality using modules that can cut across every type of VM you use.
You can also create modules that define role-specific behavior, and all these modules can be checked into source control and they can also then be deployed to a Puppet Master or Chef server.
And one of the things we’re doing this week is making it incredibly easy within Azure to basically spin up a server farm and be able to automatically deploy, provision and manage all of these machines using these popular tools.
…
We’re also excited to announce the general availability of our auto-scale service, as well as a bunch of great virtual networking capabilities including point-to-site VPN support going GA, new dynamic routing, subnet migration, as well as static internal IP address. And we think the combination of this really gives you a very flexible environment, as you saw, a very open environment, and lets you run pretty much any Windows or Linux workload in the cloud.
So we think infrastructure as a service is super-flexible, and it really kind of enables you to manage your environments however you want.
We also, though, provide prebuilt services and runtime environments that you can use to assemble your applications as well, and we call these platform as a service [PaaS] capabilities.
One of the benefits of these prebuilt services is that they enable you to focus on your application and not have to worry about the infrastructure underneath it.
We handle patching, load balancing, high availability and auto scale for you. And this enables you to work faster and do more.
What I want to do is just spend a little bit of time talking through some of these platform as a service capabilities, so we’re going to start talking about our Web functionality here today.

[Web] One of the most popular PaaS services that we now have on Windows Azure is something we call the Azure Website Service. This enables you to very easily deploy Web applications written in a variety of different languages and host them in the cloud. We support .NET, NOJS, PHP, Python, and we’re excited this week to also announce that we’re adding Java language support as well.

This enables you as a developer to basically push any type of application into Azure into our runtime environment, and basically host it to any number of users in the cloud.
Couple of the great features we have with Azure include auto-scale capability. What this means is you can start off running your application, for example, in a single VM. As more load increases to it, we can then automatically scale up multiple VMs for you without you having to write any script or take any action yourself. And if you get a lot of load, we can scale up even more.
You can basically configure how many VMs you maximally want to use, as well as what the burn-down rate is. And as your traffic — and this is great because it enables you to not only handle large traffic spikes and make sure that your apps are always responsive, but the nice thing about auto scale is that when the traffic drops off, or maybe during the night when it’s a little bit less, we can automatically scale down the number of machines that you need, which means that you end up saving money and not having to pay as much.
One of the really cool features that we’ve recently introduced with websites is something we call our staging support. This solves kind of a pretty common problem with any Web app today, which is there’s always someone hitting it. And how do you stage the deployments of new code that you roll out so that you don’t ever have a site in an intermediate state and that you can actually deploy with confidence at any point in the day?
And what staging support enables inside of Azure is for you to create a new staging version of your Web app with a private URL that you can access and use to test. And this allows you to basically deploy your application to the staging environment, get it ready, test it out before you finally send users to it, and then basically you can push one button or send a single command called swap where we’ll basically rotate the incoming traffic from the old production site to the new staged version.
What’s nice is we still keep your old version around. So if you discover once you go live you still have a bug that you missed, you can always swap back to the previous state. Again, this allows you to deploy with a lot of confidence and make sure that your users are always seeing a consistent experience when they hit your app.
Another cool feature that we’ve recently introduced is a feature we call Web Jobs. And this enables you to run background tasks that are non-HTTP responsive that you can actually run in the background. So if it takes a while to run it, this is a great way you can offload that work so that you’re not stalling your actual request response thread pool.
Basically, you know, common scenario we see for a lot of people is if they want to process something in the background, when someone submits something, for example, to the website, they can go ahead and simply drop an item into a queue or into the storage account, respond back down to the user, and then with one of these Web jobs, you can very easily run background code that can pull that queue message and actually process it in an offline way.
And what’s nice about Web jobs is you can run them now in the same virtual machines that host your websites. What that means is you don’t have to spin up your own separate set of virtual machines, and again, enables you to save money and provides a really nice management experience for it.
The last cool feature that we’ve recently introduced is something we call traffic manager support. With Traffic Manager, you can take advantage of the fact that Azure runs around the world, and you can spin up multiple instances of your website in multiple different regions around the world with Azure.
What you can then do is use Traffic Manager so you can have a single DNS entry that you then map to the different instances around the world. And what Traffic Manager does is gives you a really nice way that you can actually automatically, for example, route all your North America users to one of the North American versions of your app, while people in Europe will go routed to the European version of your app. That gives you better performance, response and latency.
Traffic Manager is also smart enough so that if you ever have an issue with one of the instances of your app, it can automatically remove it from those rotations and send users to one of the other active apps within the system. So this gives you also a nice way you can fail over in the event of an outage.
And the great thing about Traffic Manager, now, is you can use it not just for virtual machines and cloud services, but we’ve also now enabled it to work fully with websites.
…
[From BUILD Day 2: Keynote Summary [by Steve Fox [MSFT] on MSDN Blogs, April 3, 2014]]
Scott then invited Mads Kristensen on stage to walk through a few of the features that Scott discussed at a higher level. Specifically, he walked through the new ASP.NET templates emphasizing the creation of the DB layer and then showing PowerShell integration to manage your web site. He then showed Angular integration with Azure Web sites, emphasizing easy and dynamic ways to update your site showing deep browser and Visual Studio integration (Browser Link), showing updates that are made in the browser show up in the code in Visual Studio. Very cool!!
He also showed how you can manage staging and production sites by using the “swap” functionality built into the Azure Web sites service. He also showed Web Jobs to show how you can also run background jobs and Traffic Manager functionality to ensure your customers have the best performing web site in their regions.
So as Mads showed, there are a lot of great features that we’re kind of unveiling this week. A lot of great announcements that go with it.
These include the general availability release of auto-scale support for websites, as well as the general availability release of our new Traffic Manager support for websites as well. As you saw there, we also have Web Job support, and one of the things that we didn’t get to demo which is also very cool is backup support so that automatically we can have both your content as well as your databases backed up when you run them in our Websites environment as well.
Lots of great improvements also coming in terms of from an offer perspective. One thing a lot of people have asked us for with Websites is the ability not only to use SSL, but to use SSL without having to pay for it. So one of the cool things that we’re adding with Websites and it goes live today is we’re including one IP address-based SSL certificate and five SNI-based SSL certificates at no additional cost to every Website instance. (Applause.)
Throughout the event here, you’re also going to hear a bunch of great sessions on some of the improvements we’re making to ASP.NET. In terms of from a Web framework perspective, we’ve got general availability release of ASP.NET MVC 5.1, Web API 2.1, Identity 2.0, as well as Web Pages 3.1 So a lot of great, new features to take advantage of.
As you saw Mads demo, a lot of great features inside Visual Studio including the ability every time you create an ASP.NET project now to automatically create an Azure Website as part of that flow. Remember, every Azure customer gets 10 free Azure Websites that you can use forever. So even if you’re not an MSDN customer, you can take advantage of that feature in order to set up a Web environment literally every time you create a new project. So pretty exciting stuff.
So that was one example of some of the PaaS capabilities that we have inside Azure.
[Mobile] I’m going to move now into the mobile space and talk about some of the great improvements that we’re making there as well.
One of the great things about Azure is the fact that it makes it really easy for you to build back ends for your mobile applications and devices. And one of the cool things you can do now is you can develop those back ends with both .NET as well as NOJS, and you can use Visual Studio or any other text editor on any other operating system to actually deploy those applications into Azure.
And once they’re deployed, we make it really easy for you to go ahead and connect them to any type of device out there in the world.


Now, some of the great things you can do with this is take advantage of some of the features that we have, which provide very flexible data handling. So we have built-in support for Azure storage, as well as our SQL database, which is our PaaS database offering for relational databases, as well as take advantage of things like MongoDB and other popular NoSQL solutions.

We support the ability not only to reply to messages that come to us, but also to push messages to devices as well. One of the cool features that Mobile Services can take advantage of — and it’s also available as a stand-alone feature — is something we call notification hubs. And this basically allows you to send a single message to a notification hub and then broadcast it to, in some cases, devices that might be registered to it.
We also support with Mobile Services a variety of flexible authentication options. So when we first launched mobile services, we added support for things like Facebook login, Google ID, Twitter ID, as well as Microsoft Accounts.
One of the things we’re excited to demo here today is Active Directory support as well. So this enables you to build new applications that you can target, for example, your employees or partners, to enable them to sign in using the same enterprise credentials that they use in an on-premises Active Directory environment.
What’s great is we’re using standard OAuth tokens as part of that. So once you authenticate, you can take that token, you can use it to also provide authorization access to your own custom back-end logic or data stores that you host inside Azure.
We’re also making it really easy so that you can also take that same token and you can use it to access Office 365 APIs and be able to integrate that user’s data as well as functionality inside your application as well.
The beauty about all of this is it works with any device. So whether it’s a Windows device or an iOS device or an Android device, you can go ahead and take advantage of this capability.
…
[From BUILD Day 2: Keynote Summary [by Steve Fox [MSFT] on MSDN Blogs, April 3, 2014]]
Yavor Georgiev then came on stage to walk through a Mobile Services demo. He showed off a new Mobile Services Visual Studio template, test pages with API docs, local and remote debugging capabilities, and a LOB app that enables Facilities departments to manage service requests—this showed off a lot of the core ASP.NET/MVC features along with a quick publish service to your Mobile Services service in Azure. Through this app, he showed how to use Active Directory to build the app—which prompts you to log into the app with your corp/AD credentials to use the app. He then showed how the app integrates with SharePoint/O365 such that the request leverages the SharePoint REST APIs to publish a doc to a Facilities doc repository. He also showed how you can re-use the core code through Xamarin to repurpose the code for iOS.The app is shown here native in Visual Studio.
This app view is the cross-platform build using Xamarin.
Kudos to Yavor! This was an awesome demo that showcases how far Mobile Services has come in a short period of time—love the extensibility and the cross-platform capabilities. Very nice!
One of the things that kind of Yavor showed there is just sort of how easy it is now to build enterprise-grade mobile applications using Azure and Visual Studio.
And one of the key kind of lynchpins in terms of from a technology standpoint that really makes this possible is our Azure Active Directory Service. This basically provides an Active Directory in the cloud that you can use to authenticate any device. What makes it powerful is the fact that you can synchronize it with your existing on-premises Active Directory. And we support both synch options, including back to Windows Server 2003 instances, so it doesn’t even require a relatively new Windows Server, it works with anything you’ve got.
We also support a federate option as well if you want to use ADFS. Once you set that environment up, then all your users are available to be authenticated in the cloud and what’s great is we ship SDKs that work with all different types of devices, and enables you to integrate authentication into those applications. And so you don’t everyone have to have your back end hosted on Azure, you can take advantage of this capability to enable single sign-on with any enterprise credential.
And what’s great is once you get that token, that same token can then be used to program against Office 365 APIs as well as the other services across Microsoft. So this provides a really great opportunity not only for building enterprise line-of-business apps, but also for ISVs that want to be able to build SaaS solutions as well as mobile device apps that integrate and target enterprise customers as well.
…
[From BUILD Day 2: Keynote Summary [by Steve Fox [MSFT] on MSDN Blogs, April 3, 2014]]
Scott then invited Grant Peterson from DocuSign on stage to discuss how they are using Azure, who demoed AD integration with DocuSign’s iOS app. Nice!
This is really huge for those of you building apps that are cross-platform but have big investments in AD and also provides you as developers a way to reach enterprise audiences.
So I think one of the things that’s pretty cool about that scenario is both the opportunity it offers every developer that wants to reach an enterprise audience. The great thing is all of those 300 million users that are in Azure Active Directory today and the millions of enterprises that have already federated with it are now available for you to build both mobile and Web applications against and be able to offer to them an enterprise-grade solution to all of your ISV-based applications.
That really kind of changes one of the biggest concerns that people end up having with enterprise apps with SaaS into a real asset where you can make it super-easy for them to go ahead and integrate and be able to do it from any device.
And one of the things you might have noticed there in the code that Grant showed was that it was actually all done on the client using Objective-C, and that’s because we have a new Azure Active Directory iOS SDK as well as an Android SDK in addition to our Windows SDK. And so you can use and integrate with Azure Active Directory from any device, any language, any tool.
Here’s a quick summary of some of the great mobile announcements that we’re making today. Yavor showed we now have .NET backend support, single sign-on with Active Directory.
One of the features we didn’t get a chance to show, but you can learn more about in the breakout talk is offline data sync. So we also now have built into Mobile Services the ability to sync and handle disconnected states with data. And then, obviously, the Visual Studio and remote debugging capabilities as well.
We’ve got not only the Azure SDKs for Azure Active Directory, but we also now have Office 365 API integration. We’re also really excited to announce the general availability or our Azure AD Premium release. This provides enterprises management capabilities that they can actually also use and integrate with your applications, and enables IT to also feel like they can trust the applications and the SaaS solutions that their users are using.
And then we have a bunch of great improvements with notification hubs including Kindle support as well as Visual Studio integration.
So a lot of great features. You can learn about all of them in the breakout talks this week.
So we’ve talked about Web, we’ve talked about mobile when we talk about PaaS.
[Data] I want to switch gears now and talk a little bit about data, which is pretty fundamental and integral to building any type of application.


And with Azure, we support a variety of rich ways to handle data ranging from unstructured, semistructured, to relational. One of the most popular services you heard me talk about at the beginning of the talk is our SQL database story. We’ve got over a million SQL databases now hosted on Azure. And it’s a really easy way for you to spin up a database, and better yet, it’s a way that we then manage for you. So we do handle things like high availability and patching.
You don’t have to worry about that. Instead, you can focus on your application and really be productive.
We’ve got a whole bunch of great SQL improvements that we’re excited to announce this week. I’m going to walk through a couple of them real quickly.
One of them is we’re increasing the database size that we support with SQL databases. Previously, we only supported up to 150 gigs. We’re excited to announce that we’re increasing that to support 500 gigabytes going forward. And we’re also delivering a new 99.95 percent SLA as part of that. So this now enables you to run even bigger applications and be able to do it with high confidence in the cloud. (Applause.)
Another cool feature we’re adding is something we call Self-Service Restore. I don’t know if you ever worked on a database application where you’ve written code like this, hit go, and then suddenly had a very bad feeling because you realized you omitted the where clause and you just deleted your entire table. (Laughter.)
And sometimes you can go and hopefully you have backups. This is usually the point when you discover when you don’t have backups.
And one of the things that we built in as part of the Self-Service Restore feature is automatic backups for you. And we actually let you literally roll back the clock, and you can choose what time of the day you want to roll it back to. We save up to I think 31 days of backups. And you can basically rehydrate a new database based on whatever time of the day you wanted to actually restore from. And then, hopefully, your life ends up being a lot better than it started out.
This is just a built-in feature. You don’t have to turn it on. It’s just sort of built in, something you can take advantage of. (Applause.)
Another great feature that we’re building in is something we call active geo-replication. What this lets you do now is you can actually go ahead and run SQL databases in multiple Azure regions around the world. And you can set it up to automatically replicate your databases for you.
And this is basically an asynchronous replication. You can basically have your primary in rewrite mode, and then you can actually have your secondary and you can have multiple secondaries in read-only mode. So you can still actually be accessing the data in read-only mode elsewhere.
In the event that you have a catastrophic issue in, say, one region, say a natural disaster hits, you can go ahead and you can initiate the failover automatically to one of your secondary regions. This basically allows you to continue moving on without having to worry about data loss and gives you kind of a really nice, high-availability solution that you can take advantage of.
One of the things that’s nice about Azure’s regions is we try to make sure we have multiple regions in each geography. So, for example, we have two regions that are at least 500 miles away in Europe, and in North America, and similarly with Australia, Japan and China. And what that means is that you know if you do need to fail over, your data is never leaving the geo-political area that it’s based in. And if you’re hosted in Europe, you don’t have to worry about your data ever leaving Europe, similarly for the other geo-political entities that are out there.
So this gives you a way now with high confidence that you can store your data and know that you can fail over at any point in time.
In addition to some of these improvements with SQL databases, we also have a host of great improvements coming with HDInsight, which is our big data analytics engine. This runs standard Hadoop instance and runs it as a managed service, so we do all the patching and management for you.
We’re excited to announce the GA of Hadoop 2.2 support. We also have now .NET 4.5 installed and APIs available so you can now write your MapReduce jobs using .NET 4.5.
We’re also adding audit and operation history support, a bunch of great improvements with Hive, and we’re now Yarn-enabling the cluster so you can actually run more software on it as well.
And we’re also excited to announce a bunch of improvements in the storage space, including the general availability of our read-access geo-redundant storage option.
So we’ve kind of done a whole bunch of kind of deep dives into a whole bunch of the Azure features.
More information:
- Announcing release of Visual Studio 2013 Update 2 RC and Azure SDK 2.3 [Windows Azure Blog, April 4, 2014]
- Deep dive: Visual Studio 2013 Update 2 RC and Azure SDK 2.3 [Windows Azure Blog, April 9, 2014]
- Azure Updates: Web Sites, VMs, Mobile Services, Notification Hubs, Storage, VNets, Scheduler, AutoScale and More [ScottGu’s Blog, April 14, 2014] [Data]
It has been a really busy last 10 days for the Azure team. This blog post quickly recaps a few of the significant enhancements we’ve made. These include:
- [Web] Web Sites: SSL included, Traffic Manager, Java Support, Basic Tier
- [IaaS] Virtual Machines: Support for Chef and Puppet extensions, Basic Pricing tier for Compute Instances
- [IaaS] Virtual Network: General Availability of DynamicRouting VPN Gateways and Point-to-Site VPN
- [Mobile] Mobile Services: Preview of Visual Studio support for .NET, Azure Active Directory integration and Offline support;
- [Mobile] Notification Hubs: Support for Kindle Fire devices and Visual Studio Server Explorer integration
- [IaaS] [Web] Autoscale: General Availability release
- [Data] Storage: General Availability release of Read Access Geo Redundant Storage
- [Mobile] Active Directory Premium: General Availability release
- Scheduler service: General Availability release
- Automation: Preview release of new Azure Automation service
All of these improvements are now available to use immediately (note that some features are still in preview). Below are more details about them:
…
- [Web] Azure Web Sites New Basic Pricing Tier [Windows Azure Blog, April 21, 2014]
… With the April updates to Microsoft Azure, Azure Web Sites offers a new pricing tier called Basic. The Basic pricing tier is designated for production sites, supporting smaller sites, as well as development and testing scenarios. … Which pricing tier is right for me? … The new pricing tier is a great benefit to many customers, offering some high-end features at a reasonable cost. We hope this new offering will enable a better deployment for all of you.
- [Web] Java on Azure Web Sites [Windows Azure Blog, April 4, 2014]
Microsoft is launching support for Java-based web sites on Azure Web Sites. This capability is intended to satisfy many common Java scenarios combined with the manageability and easy scaling options from Azure Web Sites.
…
The addition of Java is available immediately on all tiers for no additional cost. It offers new possibilities to host your pre-existing Java web applications. New Java web site development on Azure is easy using the Java Azure SDK which provides integration with Azure services.
- [Web] Introducing Web Hosting Plans for Azure Web Sites [Windows Azure Blog, April 4, 2014]
With the latest release of Azure Web Sites and the new Azure Portal Preview we are introducing a new concept: Web Hosting Plans. A Web Hosting Plan (WHP) allows you to group and scale sites independently within a subscription.
…
- Microsoft Azure Load Balancing Services [Windows Azure Blog, April 8, 2014]
Microsoft Azure offers load balancing services for [IaaS] virtual machines (IaaS) and [Web] cloud services (PaaS) hosted in the Microsoft Azure cloud. Load balancing allows your application to scale and provides resiliency to application failures among other benefits.
The load balancing services can be accessed by specifying input endpoints on your services either via the Microsoft Azure Portal or via the service model of your application. Once a hosted service with one or more input endpoints is deployed in Microsoft Azure, it automatically configures the load balancing services offered by Microsoft Azure platform. To get the benefit of resiliency / redundancy of your services, you need to have at least two virtual machines serving the same endpoint.
…
- [Web] What’s New for ASP.NET and Web in Visual Studio 2013 Update 2 and Beyond [jlongo62 YouTube channel, published on April 22, 2014]
- [Mobile] Push Notifications Using Notification Hub and .NET Backend [Azure Mobile Services Team Blog, April 8, 2014]
When creating a Azure Mobile Service, a Notification Hub is automatically created as well enabling large scale push notifications to devices across any mobile platform (Android, iOS, Windows Store apps, and Windows Phone). For a background on Notification Hubs, see this overview as well as these tutorials and guides, and Scott Guthrie’s blog Broadcast push notifications to millions of mobile devices using Windows Azure Notification Hubs.
Let’s look at how devices register for notification and how to send notifications to registered devices using the .NET backend.
…
- [Mobile] How to create Universal applications with Azure Mobile Services that leverage push notifications and database insertion and data retrieval [by Bruno Terkalay on MSDN Blogs, April 13, 2014]
- Azure SQL Database introduces new service tiers [Windows Azure Blog, April 24, 2014]
New tiers improve customer experience and provide more business continuity options
To better serve your needs for more flexibility, Microsoft Azure SQL Database is adding new service tiers, Basic and Standard, to work alongside its Premium tier, which is currently in preview. Together these service tiers will help you more easily support the needs of database workloads and application patterns built on Microsoft Azure. … Previews for all three tiers are available today.
The Basic, Standard, and Premium tiers are designed to deliver more predictable performance for light-weight to heavy-weight transactional application demands. Additionally, the new tiers offer a spectrum of business continuity features, a [Data] stronger uptime SLA at 99.95%, and larger database sizes up to 500 GB for less cost. The new tiers will also help remove costly workarounds and offer an improved billing experience for you.
…
- SQL Database updates coming soon to the Premium preview [Windows Azure Blog, April 4, 2014]
… [Data] Active Geo-Replication: …
… [Data] Self-service Restore: …
Stay tuned to the Azure blog for more details on SQL Database later this month!
Also, if you haven’t tried Azure SQL Database yet, it’s a great time to start and try the Premium tier! Learn more today!
- What’s new in the cluster versions provided by HDInsight? [Azure article, April 3, 2014]
Azure HDInsight now supports [Data] Hadoop 2.2 with HDInsight cluster version 3.0 and takes full advantage of these platform to provide a range of significant benefits to customers. These include, most notably:
- Microsoft Avro Library: …
[Data] YARN: A new, general-purpose, distributed, application management framework that has replaced the classic Apache Hadoop MapReduce framework for processing data in Hadoop clusters. It effectively serves as the Hadoop operating system, and takes Hadoop from a single-use data platform for batch processing to a multi-use platform that enables batch, interactive, online and stream processing. This new management framework improves scalability and cluster utilization according to criteria such as capacity guarantees, fairness, and service-level agreements.
High Availability: …
[Data] Hive performance: Order of magnitude improvements to Hive query response times (up to 40x) and to data compression (up to 80%) using the Optimized Row Columnar (ORC) format.
Pig, Sqoop, Qozie, Ambari: …
…
The lost U.S. grip on the mobile computing market, including not only the device business, but software development and patterns of use in general
This is my conclusion after the two sections of analysis presented below:
I. China-based white-box tablet and smartphone vendors were shaping the 2013 global device market which will even more so in 2014
II. Asia is following different patterns of mobile use than the United States – the case of China and South Korea
The single, most forceful evidence for all of the above is the extraordinary presentation of Hugo Barra, Vice President, Xiaomi Global & Loic Le Meur, LeWeb Founders- LeWeb’13 Paris – [LeWebYouTube channel, Dec 11, 2013]
I. China-based white-box tablet vendors and smartphone vendors were shaping the 2013 global device market which will even more so in 2014
My analysis of the smartphone market in general was first presented in the Device businesses should have a China-based independent headquarter at least for Asia/Pacific if they want to succeed [‘Experiencing the Cloud’, Jan 28, 2014] and then it was already updated by the recent Chinese smartphone brands to conquer the global market? [‘Experiencing the Cloud’, March 18, 2014] post of mine.
As a Q4’13 update to The tablet market in Q1-Q3’13: It was mainly shaped by white-box vendors while Samsung was quite successfully attacking both Apple and the white-box vendors with triple digit growth both worldwide and in Mainland China [‘Experiencing the Cloud’, Nov 14, 2013] post of mine I should first add here the following analysis:

Note that the white-box tablet shipments from China were estimated by company data and Credit Suisse estimates as 7% and 10% higher: 2012: 58M (vs. 54.4M here), 2013: 98M (vs. 89.1M here) (as per the “Figure 30” chart in this blog below). As you see here and later on the conclusion of the Q1-Q3’13 analysis for the tablet market, represented by the title of the previous post will hold for the whole CY2013 as well. The only remarkable change is the sudden jump in Apple iPad sales in Q4, both worldwide and in China. This is, however, only attributed to Q4 introduction of the new iPad Air which was much anticipated for months, thus postponement of new purchases and the peak when it was available. So, for the whole year, my conclusion still holds true,
 Note that the 2013 tablet market in China was 17.2M as per the above data, while the 2013 worldwide tablet market was 219.5M per IDC, and 255M according to company data and Credit Suisse estimates (as per the “Figure 30” chart in this blog below). So China was just 7.8% or 6.4% of the worldwide tablet market, while China shipped significantly more, 38.4% of the worldwide tablet market by the Chinese white-box vendors only (the last one according to company data and Credit Suisse estimates). This is 5.5% higher than the share of China-based smartphone vendors in the global 2013 smartphone shipments (32.9%, according to DIGITIMES Research—see well below), although in tablet space only Lenovo was a significant player, while in smartphones Huawei, ZTE, Coolpad and TCL were also signicant ones (being actually in the global Top 10). In addition a much higher portion of that was shipped internally: about 50% according to company data and Credit Suisse estimates (as per the “Figure 25” chart in this blog below), while for tablets 3M local brand tablets were shipped (as per Analysys International, see the above chart) against 98M of white-box tablets only (as per company data and Credit Suisse estimates), i.e. around 3%. Even taking the DIGITIMES Research’ 54.4M white-box tablet shipment data as the basis, this number will only climb to around 5.5%.


Then I need to add here some external analysis as well, for both the smartphone and tablet markets:
From Taiwan Display IC Sector [Credit Suisse Equity research, March 12, 2014]
[p. 10] … We are … seeing entry level tablet shifting from 7″ to 8″ with higher resolutions given the competition from large size smartphone (Phablet). Tablet brands also plan to introduce over 10″ models for more commercial applications. …
China smartphone will continue to proliferate
Credit Suisse Global Research team estimates global smartphone shipment growth of 18% CAGR in 2013-2016E, while China build smartphone shipment (domestic and export) will see 29% CAGR in 2013-16E. For 2014, we forecast total China smartphone DDI [Display Driver IC] demand of 650-700mn units, up 33-36% YoY, and panel resolution to see faster migration on aggressive pricing and less capacity constraint …
[p. 10] Tablet unit demand still solid in 2014 post strong 2013
Tablet set shipment growth is expected to slow down in 2014 (34% YoY) after a strong 57% YoY growth in 2013 and 107% YoY growth in 2012. However, we believe Chinese tablet makers (brand and whitebox) … will outgrow the industry thanks to further cost reduction …
[p. 11] We estimate there will be limited growth for high-end or branded tablets in 2014, with the exception of Samsung (60% YoY growth). We believe the overall tablet demand will be driven by the Chinese, such as Lenovo and whitebox makers.
[2011: 73M*, 2012: 163M, 2013: 255M, 2014E: 342M]
* Samsung’s own data: 2010: 1.5M, 2011: 5.8M, 2012: 16.6M
** Note that the white-box tablet shipments were estimated by DIGITIMES Research as lower: 2012: 54.4M (vs. 58M here), 2013: 89.1M (vs. 98M here)
(as per the 1st chart in this blog above)


2014 China smartphone market and industry – Forecast and analysis [DIGITIMES Research, March 24, 2014]
Digitimes Research expects demand in the domestic China market to reach 422 million smartphones in 2014, with 278 million units contributed by China-based smartphone vendors. The continued expansion by international vendors Samsung and Apple will push up their sales to almost 144 million units, accounting for nearly 4% growth from 2013. As competition in the local market heats up, China-based vendors are turning to overseas markets in order to maintain their shipment volumes, especially taking an aggressive approach to penetrating emerging markets, which hold higher barriers for overseas vendors to enter.
The outlook for the 2014 China domestic smartphone market is that fewer local brands will remain to compete in the market. With the general enhancement of software-hardware specifications in 2013, brand-building and channel management have become the key to sustainability. Vendors without the advantage of substantial product differentiation will face the challenge of being eliminated in the short term. On the other hand, local vendors need to deal with inventories with discretion to counter the vigorous attacks initiated by international vendors in the domestic market.
In terms of the China smartphone industry, Digitimes Research expects global shipments of China-based smartphone vendors to reach 412 million units in 2014, a 30.7% increase from 2013. Overseas shipments will account for about 126 million units. While shipments to mature markets are expected to grow on a small scale, shipments to emerging markets are expected to expand at strong rates, mainly due to the low base they are starting from.
In the forecast for shipments from different vendors in 2014, Lenovo and Huawei are expected to reach 50 million units. Huawei has been engaged in overseas markets for a long time so its export portion outweighs Lenovo’s. ZTE’s and CoolPad‘s shipments are expected to reach 35.5 million units. TCL [Alcatel] has shown a significant growth in exports with shipments expected to exceed 26 million units in 2014, ranking No. 5 on the list. Second-tier vendors Gionee and Xiaomi are expected to ship 20 million units.

Digitimes Research: China smartphone shipments to decline slightly in 1Q14 [DIGITIMES Research, Feb 7, 2014]
China-based handset companies are expected to see their shipments of smartphones decline lightly in the first quarter of 2014, after combined shipments posted a 13% sequential growth in the previous quarter, according to Digitimes Research.
Efforts by brand vendors to clear out entry-level models in previous quarters and increased overseas shipments by Huawei, ZTE and TCL contributed to shipment gains the fourth quarter of 2013.
Additionally, first- and second-tier vendors also launched a number of new models in the fourth quarter to meet demand during the year-end buying season, ramping up total shipments in the quarter.
For all of 2013, China-based handset makers shipped a total of 314 million smartphones, increasing 62.4% from a year earlier, Digitimes Research said.
Second-tier vendors, including Xiaomi Technology, TCL, Oppo Mobile and Gionee managed to ship over 15 million smartphones in 2013.
Digitimes Research: Global smartphone shipments to top 1.24 billion units in 2014 [DIGITIMES Research, Jan 14, 2014]
Global smartphone shipments are expected to top 1.24 billion units in 2014, with Samsung Electronics, Apple, LG Electronics, Sony Mobile Communications, Lenovo, Huawei, Microsoft, ZTE, Coolpad and TCL serving as top-10 vendors, according to Digitimes Research.
Apple may see its shipments double in 2014 largely due to increased shipments to China and Japan as it will benefit from its cooperation with the largest telecom operators in the two countries, said Digitimes Research.
The growth rate for Samsung will be limited in 2014 as its sales in the US, China and Japan will be depressed by growing popularity of iPhones.
China-based Lenovo, Huawei and Coolpad are expected to step up their efforts to boost sales in overseas markets after being enlisted among the top-10 vendors due to higher shipment volumes in the home market in China.
However, TCL and ZTE will continue to ship smartphones to overseas markets mainly, but will also strengthen sales in China, with domestic sales to account for less than 50% of their total shipments in 2014, commented Digitimes Research.
2014 global smartphone market forecast [DIGITIMES Research, Jan 7, 2014]
In 2014, smartphones are expected to continue penetrating rapidly into emerging markets such as Russia, India, Indonesia and Latin America, while China’s smartphone shipments will see weakened on-year growth in the year, but still enormous volume. This report will provide in-depth analyses to forecast whether global smartphone shipments in 2014 will maintain a growth similar to that of 2013 and what the global shipment scale will reach in 2014.
Within the top-10 smartphone vendors in 2013, four of them are from China and in 2014 more China-based vendors are expected to enter the top 10. This report will also analyze which China-based vendors will have the best chance to become parts of the top-tier players.
How Microsoft’s acquisition of Nokia’s handset business will affect Windows Phone products’ shipment growth in 2014 and shake Android and iOS’ domination in the smartphone market, as well as the possibility of Amazon and Facebook joining the smartphone competition in 2014 and their potential influence to the market will also be analyzed within the report.

Digitimes Research: Global smartphone shipments to reach 1.24 billion in 2014 [DIGITIMES Research, Nov 25, 2013]
Global smartphone shipments are expected to reach about 1.24 billion in 2014, up 30% on year [i.e. 954M in 2013], according to Digitimes Research.
The increase in growth is expected to be driven by demand in Russia, India, Indonesia and Latin America countries.
Digitimes Research believes that Samsung Electronics will lead the way in shipments followed by Apple, LG Electronics, Sony, Lenovo, Huawei Device, Microsoft, ZTE, Coolpad and TCL [Alcatel].
Android and IOS operating systems are expected to be used in about 93% of the devices shipped in 2014, added Digitimes Research.
Global tablet market – 4Q 2013 [DIGITIMES Research, March 24, 2014]

Global tablet shipments grew 25% sequentially and 29.8% on year to reach 78.45 million units in the fourth quarter of 2013 benefiting mainly by economic recoveries of Europe and North America, which relatively boosted demand during the year-end holidays.
Digitimes Research: Global tablet shipments in 1Q14 to drop over 20% sequentially [DIGITIMES Research, Jan 27, 2014]
An estimated 62.14 million tablets will ship globally in the first quarter of 2014, decreasing 20.8% on quarter but increasing 10.9% on year, according to Digitimes Research.
iPads will account for 29% of shipments, brand models launched by vendors other than Apple for 36.7%, and models launched by white-box vendors for 34.3%, Digitimes Research indicated.
Of brand tablet shipments in particular, Android-based models will take up 50.5%, iOS-based 44.1% and Windows-based 5.4%. 7.9-inch models will account for 24.8% of the shipments, followed by 7-inch models with 20.2%, 9-inch models with 19.6%, 10-inch models with 18.3% and 8-inch models with 15.3%. In terms of touch solutions, GFF will account for 47.8% of shipments, GF2 for 42.9%, OGS for 5.3%, GG for 2.7% and G1F for 1.3%.
Among vendors, Apple will have the largest global market share at 29%, followed by Samsung Electronics with 23.1%, Lenovo 4.7%, Asustek Computer 2.7%, Amazon 1%, Acer 1%, Microsoft 0.9%, Dell 0.8%, Google 0.5% and Hewlett-Packard 0.5%.
Taiwan-based ODMs/OEMs will ship 22.5 million tablets in the quarter, taking up 55.1% of total brand model shipments. Foxconn Electronics will account for 51.7% of shipments, Pegatron 34.8%, Compal Electronics 5.1%, Wistron 4.3% and Quanta Computer 4.1%.
Digitimes Research: Global tablet shipments in 4Q13 estimated at 78.45 million units [DIGITIMES Research, Jan 24, 2014]
There were an estimated 78.45 million tablets shipped globally in the fourth quarter of 2013, increasing 25% on quarter and by 29.8% on year, according to Digitimes Research.
iPads accounted for 29.7% of shipments, brand models launched by vendors other than Apple for 36.6%, and models launched by white-box vendors for 33.8%, Digitimes Research indicated. Android-based models took up 51.2% of the shipments, iOS-based 44.9% and Windows-based 3.9%. 7-inch models accounted for 31% of the shipments, followed by 9-inch models with 25.4%, 7.9-inch models with 19.7%, 10-inch models with 15.8% and 8-inch models with 7.6%. In terms of touch solutions, GF2 accounted for 41.5% of shipments, GFF for 38.6%, OGS for 9.8% and GG for 9.5%.
Among vendors, Apple had the largest global market share at 29.7%, followed by Samsung Electronics with 17.4%, Amazon 5.4%, Lenovo 4.2%, Asustek Computer 2.8%, Google 1.4%, Acer 1%, Dell 0.8% and Hewlett-Packard 0.5%.
Taiwan-based ODMs/OEMs shipped 32.8 million tablets in the fourth quarter, with Foxconn Electronics accounting for 52.7%, Pegatron 24.4%, Compal Electronics 12%, Quanta Computer 6.6% and Wistron 4.2%.
II. Asia is following different patterns of mobile use than the United States – the case of China and South Korea
The Post-PC Era: Is the U.S. losing its grip on the software industry? [Flurry Blog, Aug 29, 2013]

Just five years ago, PCs reigned supreme and so did the US software industry. In 2008, U.S. companies produced an estimated 65% of all PC software units sold on a worldwide basis.
In only half a decade, smartphones, tablets, and perhaps most importantly, apps, have changed the nature of the software industry. In this post we look at where apps are being developed and used and discuss the implications of that for the Post-PC Era software industry.
More Apps Are Now Being Created Outside The U.S. Than Inside The U.S.
… By June of this year only 36% of the apps we measure were made in the U.S.A. …
…
U.S. Made Apps Still Dominate App Engagement, But Their Share Is Slipping
Of course, some apps enjoy much greater use than others, so we next considered how the picture changes if apps are weighted by total time, which takes into account both user numbers and engagement. Once time is taken into account, things look considerably better for the U.S., suggesting that, on average, user numbers or engagement are greater for apps made in the U.S. than for apps created elsewhere. That makes sense given the size of the U.S. population, the fact that it was an app pioneer country, and the number of English speakers in other countries who might be able to use U.S.-made apps without any localization. Nonetheless, even the weighted percentage of apps made in the U.S.A. has dropped in the past year.

Use of Local Apps Is Strong In China
This should not lull U.S. app developers into a false sense of security however. That becomes evident from examining where the apps used by people in particular countries are made. That’s what the chart below does, starting with the United States. Nearly sixty percent (59%) of the time U.S. users spend in apps is spent in apps developed domestically, meaning that more than 40% of the app time of U.S. consumers is already spent in apps developed in other countries.
And while U.S. made apps are used elsewhere, unsurprisingly, people in many other countries spend a significant amount of their app time in apps developed in their home countries. For example, 13% of the time spent in apps in the UK is spent in apps made in the UK and 8% of the time spent in apps in Brazil is spent in apps made in Brazil. But as is so often the case, it’s China where things get really interesting. Nearly two-thirds of the time spent in apps in China is spent in apps made in China. U.S. made apps only account for 16% of total time spent in apps in China. The size and growth rate of the Chinese app market imply that the worldwide share of time spent in apps that are produced in the U.S. can be expected to contract further.
China Report: Device and App Trends in the #1 Mobile Market [Flurry Blog, July 23, 2013]

In June of this year Flurry Analytics measured 261,333,271 active smartphones and tablets in China. That represented a whopping 24% of the entire worldwide connected device installed base measured by Flurry.
…
Smartphones and tablets are not just about fun and games in China. Compared to iOS device owners elsewhere, the average time Chinese owners spend using Books, Newsstand, Utility, and Productivity apps is greater than the rest of the world (1.8x, 1.7x, 2.3x, and 2.1x respectively). On average Chinese owners of Android devices spend more than seven times as much time in Finance apps (7.4x) than Android owners elsewhere spend in Finance apps, but they also spend more time in Entertainment apps (1.7x).

The South Korea Report: Device and App Trends in The First Saturated Device Market [Flurry Blog, Oct 14, 2013]

In August of this year Flurry Analytics measured 33,527,534 active smartphones and tablets in South Korea. While that was only 2.8% of the entire worldwide connected device installed base Flurry measures, South Korea is an important market for connected devices for several reasons. First, it is the first connected device market in the world to approach saturation. Second, it is Samsung’s home market, and largely as a consequence of that, more of the devices in use there are manufactured by domestic firms than is the case for any other country. Finally, it is home to more phablet fans than anywhere else.
…Social networking accounts for a significant share of app activity in South Korea, as it does in many other countries. Tool apps are used heavily by South Korean Android users, and entertainment apps capture a lot of time spent in iOS apps.
Compared to app users elsewhere, South Koreans over-index on Entertainment apps on iOS and several Android app categories (Media / Video, Photography, Lifestyle, Shopping, and Tools).
…
Given that South Korea’s rapid period of connected device growth was ushered in by the phablet, it is perhaps not surprising that it continues to surpass the rest of the world in its preference for that form factor. As shown below, in a worldwide sample of 97,963 iOS and Android devices, only 7% were phablets, but for South Korea that percentage was 41%. The appeal of phablets in South Korea appears to suppress the tablet market there. Worldwide, 19% of the devices in our sample were tablets compared to only 5% in South Korea.


Worldwide:
Size Matters for Connected Devices. Phablets Don’t. [Flurry Blog, April 1, 2013]


… For this study, we focused on the top 200 device models, as measured by active users in Flurry’s system, which represent more than 80% of all usage. Doing so, five groups emerged based on screen size:
1. Small phones (e.g., most Blackberries), 3.5” or under screens
2. Medium phones (e.g., iPhone), between 3.5” – 4.9” screens
3. Phablets (e.g., Galaxy Note), 5.0” – 6.9” screens
4. Small Tablets (e.g., Kindle Fire), 7.0” – 8.4” screens
5. Full-size tablets (e.g., the iPad), 8.5” or greater screens
…
The ‘Is it a phone or is it a tablet’ devices otherwise known as phablets have attracted interest, but currently command a relatively small share (2%) of the device installed base, and their share of active users and sessions is also relatively small.
…
Android owns the phablet market and also has the greatest proportion of devices using small tablets. iOS has the greatest share of active devices using large tablets.
…
… notice that nearly a third of time spent playing games take places on larger devices, namely full-sized tablet, small tablets and phablets. And while they command consumer time spent, they represented only 15% of device models in use in February and 21% of individual connected devices. These differences are statistically significant.Studying books and videos, it’s somewhat surprising that tablets, which possess larger screens, do not see a larger proportion of time spent. An explanation for the high concentration in time spent in smartphones could be that consumers watch videos from their smartphones on-the-go (e.g., commuting to work on public transit), whereas they opt for a bigger screen to watch video (e.g., computer or TV) when at work or home. We expect that tablets may represent a greater share of time spent in book and video apps in the future as tablet ownership expands and tablet owners branch out into more types of apps.
…
From our study, consumers most prefer and use apps on medium-sized smartphones such as the Samsung Galaxy smartphones and full-sized tablets like the iPad. In particular, smaller smartphones under-index in terms of app usage compared to the proportion of the installed base they represent, and would suggest they are not worth developers’ support.
…
Mobile Use Grows 115% in 2013, Propelled by Messaging Apps [Flurry Blog, Jan 13, 2014]

… the segment that showed the most dramatic growth [worldwide] in 2013 was Messaging (Social and Photo sharing included). The growth in that segment should not come as a surprise to many, given the attention that messaging apps such as WhatsApp, WeChat, KakaoTalk, LINE, Facebook Messenger and SnapChat have received in the press. What is surprising, however, is that the rate of growth (tripling usage year-over-year) dramatically outpaced other popular categories. This type of growth could explain the high valuation Facebook has allegedly put on SnapChat, or Facebook’s rush to add direct messaging in Instagram, an app frequented by teens.
…
Another explosive growth year in mobile has passed. On December 31st, 2013 at 11:59 pm, Flurry Analytics tracked a record 4.7 Billion app sessions in a single day, for a total of 1.126 Trillion sessions for the whole year. Those are some very, very big numbers. …
The Truth About Cats and Dogs: Smartphone vs Tablet Usage Differences [Flurry Blog, Oct 29, 2012]
… Taking a snapshot in September 2012 from Flurry Analytics, that totaled more than 6 billion application sessions across approximately 500 million smart devices, Flurry provides a comprehensive comparison between smartphones and tablets, spanning age, gender, time of day usage, category usage and engagement metrics. For age and gender comparisons, Flurry leverages a panel of more than 30 million consumers who have opted-in to share demographic data. …
…
The chart below compares the time spent across app categories between smartphones and tablets. At a high level, consumers spend more time using tablets for media and entertainment, including Games (67%), Entertainment (9%) and News (2%) categories which account for nearly four-fifths of consumption on tablets. Smartphones claim a higher proportion of communication and task-oriented activities with Social Networking (24%), Utilities (17%), Health & Fitness (3%) and Lifestyle (3%) commanding nearly half of all usage on smartphones. Games are the most popular category on both form factors with 67% of time spent using games on tablets and 39% of time spent using games on smartphones. Further reinforcing that tablets are “media machines” is the fact that consumers spend 71% more of their time using games on tablets than they spend doing so on smartphones.

Indie Game Makers Dominate iOS and Android [Flurry Blog, March 6, 2012]
For the first two months of 2012, Flurry Analytics measured that more than half of all end user sessions were spent in games. Across January and February, Flurry observed sessions across a sample of more than 64 billion applications sessions across more than 500 million iOS and Android devices.

United States
:
Apps Solidify Leadership Six Years into the Mobile Revolution [Flurry Blog, April 1, 2014]
Last year, on the eve of the fifth anniversary of the mobile revolution, Flurry issued its five-year report on the mobile industry. In that report we analyzed time-spent on mobile devices by the average US consumer. We have run the same analysis, using data collected between January and March of 2014, and found some interesting shifts that we are sharing in this report
…The chart
belowon the left takes a closer look at app categories. Comparing them to last year, gaming apps maintained their leadership position at 32% of time spent. Social and messaging applications, including Facebook, increased share from 24% to 28%. Entertainement (including YouTube) and Utility applications maintained their positions at 8% each, while productivity apps saw their share double from 2% to 4% of the overall time spent.


Flurry Five-Year Report: It’s an App World. The Web Just Lives in It
[Flurry Blog, April 3, 2013]
… On the five-year anniversary of launching Flurry Analytics, we took some time to reflect on the industry and share some insights. First, we studied the time U.S. consumers spend between mobile apps and mobile browsers, as well as within mobile app categories. Let’s take a look. …

Mobile App Usage [in U.S.] Further Dominates Web, Spurred by Facebook [Flurry Blog, Jan 9, 2012]

The chart compares how daily interactive consumption has changed over the last 18 months between the web (both desktop and mobile web) and mobile native apps. For the web, shown in green, we built a model using publicly available data from comScore and Alexa. For mobile application usage, shown in blue, we used Flurry Analytics data, which tracks anonymous sessions across more than 140,000 applications. We estimate this accounts for approximately one third of all mobile application activity, which we scaled-up accordingly for this analysis.
…
With mobile app usage soaring, Flurry additionally studied which categories most occupy consumers’ time. The results are shown in the pie chart below.
Further considering that Flurry does not track Facebook usage, the Social Networking category is actually larger. Combined, from just what Flurry can see, these two categories control a whopping 79% of consumers’ total app time. This breakdown in usage reveals Facebook’s inherent popularity as the leading social network, as well as how important controlling the game category is for all platform providers. As we drill down into the category data, consumers use these two categories more frequently, and for longer average session lengths, compared to other categories.

Mobile Cloud Computing: proven questions and statements about the current and future state-of-the-market
- Is Android Becoming the New Windows?
- Tablets to Outsell PCs Worldwide by 2015
- Android Blows Past iOS in Global Tablet Market
- Android To Retain Big Lead In Maturing Smartphone Market
- The Price Gap Between iOS and Android Is Widening
- In Just 2 Years, Google And Facebook Have Come To Control 75% Of All Mobile Advertising
Note: In addition keep in mind at least the fact that Bloomberg (Businessweek) legitimizes Allwinner and Rockchip as challengers to Intel and Qualcomm via the tablet space, as well as Spreadtrum in the smartphone space [‘Experiencing the Cloud’, March 18, 2014]. More facts of such kind:
– Alibaba gets Tango for its push into the U.S. and the whole Western world [‘Experiencing the Cloud’, March 20, 2014]
– Chinese smartphone brands to conquer the global market? [‘Experiencing the Cloud’, March 18, 2014]
– MediaTek is repositioning itself with the new MT6732 and MT6752 SoCs for the “super-mid market” just being born, plus new wearable technologies for wPANs and IoT are added for the new premium MT6595 SoC [‘Experiencing the Cloud’, March 4, 2014]
– To watch Alisher Usmanov (Алишер Усманов) [‘Experiencing the Cloud’, March 22, 2014]
– Device businesses should have a China-based independent headquarter at least for Asia/Pacific if they want to succeed [‘Experiencing the Cloud’, Jan 28, 2014]
– 2014 will be the last year of making sufficient changes for Microsoft’s smartphone and tablet strategies, and those changes should be radical if the company wants to succeed with its devices and services strategy [‘Experiencing the Cloud’, Jan 17, 2014]
– The tablet market in Q1-Q3’13: It was mainly shaped by white-box vendors while Samsung was quite successfully attacking both Apple and the white-box vendors with triple digit growth both worldwide and in Mainland China [‘Experiencing the Cloud’, Nov 14, 2013]
– Leading PC vendors of the past: Go enterprise or die! [‘Experiencing the Cloud’, Nov 7, 2013]
– The question mark over Wintel’s future will hang in the air for two more years [‘Experiencing the Cloud’, Sept 15, 2013]
- Is Android Becoming the New Windows?
- Tablets to Outsell PCs Worldwide by 2015
- Android Blows Past iOS in Global Tablet Market
- Android To Retain Big Lead In Maturing Smartphone Market
- The Price Gap Between iOS and Android Is Widening
- In Just 2 Years, Google And Facebook Have Come To Control 75% Of All Mobile Advertising
All supported by facts and well researched forecasts by IDC, Gartner and eMarketer.

Source: Is Android Becoming the New Windows? [Statista, Jan 9, 2014]

Source: Tablets to Outsell PCs Worldwide by 2015 [Statista, Mach 1, 2014]

Source: Android Blows Past iOS in Global Tablet Market [Statista, Mach 3, 2014]

Source: Android To Retain Big Lead In Maturing Smartphone Market [Statista, Mach 4, 2014]

Source: The Price Gap Between iOS and Android Is Widening [Statista, Feb 14, 2014]

Source: In Just 2 Years, Google And Facebook Have Come To Control 75% Of All Mobile Advertising [Business Insider India, March 21, 2014]
In the last two years, Facebook and Google have gone from a position of merely being two big, fast-growing players in mobile advertising to dominating it completely. Combined, they have cornered 75.2% of the entire mobile market in 2013, according to new data by eMarketer.
In 2014, Google alone is expected to be roughly as big as all other companies combined, as this chart of mobile ad revenues from Statista shows.
“new data by eMarketer”:
Driven by Facebook and Google, Mobile Ad Market Soars 105% in 2013 [eMarketer, March 19, 2014]
Mobile ad spending on pace to reach $31.45 billion this year
Last year, global mobile ad spending increased 105.0% to total $17.96 billion, according to new figures from eMarketer. In 2014, mobile is on pace to rise another 75.1% to $31.45 billion, accounting for nearly one-quarter of total digital ad spending worldwide.
Facebook and Google accounted for a majority of mobile ad market growth worldwide last year. Combined, the two companies saw net mobile ad revenues increase by $6.92 billion, claiming 75.2% of the additional $9.2 billion that went toward mobile in 2013. The two companies are consolidating their places at the top of the market, accounting for more than two-thirds of mobile ad spending last year—a figure that will increase slightly this year, according to eMarketer.
Facebook in particular is gaining significant market share. In 2012, the social network accounted for just 5.4% of the global advertising market. In 2013, that share increased to 17.5%, and eMarketer predicts it will rise again this year to 21.7%. Google still owns a plurality of the mobile advertising market worldwide, taking a portion of nearly 50% in 2013, but the rapid growth of Facebook will cause the search giant’s share to drop to 46.8% in 2014, eMarketer estimates.
The rapid pace at which mobile has taken over the company’s ad revenue share indicates Facebook’s mobile future. In 2012, only 11% of Facebook’s net ad revenues worldwide came from mobile, and last year, that figure jumped to 45.1%. In 2014, eMarketer estimates that mobile will account for 63.4% of Facebook’s net digital ad revenues. Mobile accounted for 23.1% of Google’s net ad revenues worldwide in 2013, and eMarketer estimates this share will increase to 33.8% this year.


Chinese smartphone brands to conquer the global market?
The smartphone market in China became saturated between Q3’12 and Q4’13 as per the below chart from Analysys International (EnfoDesk):

Note that this chart corresponds to Chinese writing traditions, i.e. in Q2’11 16.81 million smartphones and 51.01 million feature phones were sold, while in Q4’13 97.63 million smartphones and 9.2 million feature phones. Source: 易观分析:2013年第4季度中国手机销量增速放缓,智能手机市场呈现饱和态势 (Analysys analysis: China mobile phone sales growth slowed in the fourth quarter of 2013, the smart phone market is saturated) [EnfoDesk, March 11, 2014]
Chinese Handset Vendors Will Account for Over 50% of Mobile Handset Sales in 2015 [ABI Research press release, March 10, 2014]
ABI Research reports that Chinese handset vendors will account for over 50% of mobile handsets in 2015. Chinese vendors already accounted for 38% of mobile handset shipments in 2013 and the ongoing shift in growth to low cost handsets, especially smartphones, will increase their market share.
Greater China has long dominated the mobile handset manufacturing supply chain, but now its OEMs are beginning to dominate sales at the expense of the traditional handset OEMs, including even Samsung.
Many of the Chinese OEMs have focused almost exclusively on the huge Chinese market, with little activity beyond its borders, but this is set to change. Huawei (6th in worldwide market share for 2013) and ZTE (5th) have already made an impact on the world stage, but other Chinese handset OEMs like Lenovo—the Motorola acquisition is a clear statement of intent—and Xiaomi are set to join them.
“Chinese vendors already take up five of the top ten places in terms of worldwide market share, despite three of them only really shipping into China. The Chinese vendors highlight the changing shape of the mobile handset market, as the Chinese manufacturing ecosystem, specifically reference designs, enable the next wave of smartphone growth in low cost emerging markets and amongst price conscious consumers everywhere,” said Nick Spencer, senior practice director, mobile devices.
“South East Asia has already experienced this trend, but ABI Research expects to see the impact of these Chinese vendors increasing in all emerging markets and even advanced markets, especially on prepay,” added Spencer.

The New Phone Giants: Indian And Chinese Manufacturers’ Fast Rise To Threaten Apple And Samsung [Business Insider India, March 15, 2014]
The top Indian and Chinese smartphone manufacturers are classically disruptive. They produce products that are “good enough,” at a fraction of the cost of comparable models from premium brands. These ultra low-cost devices are the key to nudging consumers in massively untapped markets like India and Indonesia onto smartphones.
And these companies are starting to aim higher – producing 4G LTE smartphones that have the same processing power as Samsung and Apple premium devices.
They’re also far more innovative than they’re given credit for in terms of their strategy, supply chain management, and hardware.
In a new report from BI Intelligence, we explain why global consumer Internet and mobile companies will increasingly need to work with companies like Xiaomi and Micromax – not to mention Lenovo, Huawei, ZTE, Coolpad, Karbonn, and others – if they don’t want to miss out on mobile’s next growth phase in emerging markets
- Major local manufacturers now account for two-fifths of China’s smartphone market, and one-fourth of India’s. Xiaomi already sells four of the top 10 best-selling Android devices in China, and operates one of the top five app stores.
- Combined, the top five manufacturers in China and the top two in India – the “Local 7” in the chart above – are now shipping about 65 million smartphones every quarter, more than Apple, and coming close to drawing even with Samsung.
- These local manufacturers wield influence in various ways. They run their own successful app stores, mobile operating systems, and mobile services. They also hold the keys to which apps are preloaded on their phones. When BlackBerry wanted to take its BBM messaging service for Android into India, it signed a deal with Micromax.
- The local manufacturers are not provincial outfits producing knock-offs, as some might be inclined to assume. But their main competitive tool, for now, remains price. Local manufacturers in China and India match the features of more expensive devices and manage to produce comparable hardware at a fraction of the price. A Micromax handset comparable to Apple’s iPhone 5C costs less than one-fourth as much.
- Xiaomi has used a four-point strategy in its three-year rise to produce four of the most popular phone models in China. We discuss all four aspects, including tight inventory management and crowdsourcing product development feedback.
- These manufacturers will continue to expand overseas, in search of new growth opportunities. Micromax is in Nepal, Bangladesh, and Sri Lanka. Xiaomi has its eyes on Malaysia and Brazil. Huawei is already in the U.S. For example, it sells a 4G LTE handset on MetroPCS.
Smartphone Prices Race to the Bottom as Emerging Markets Outside of China Come into the Spotlight for Future Growth, According to IDC [press release, Feb 24, 2014]
Singapore and London, February 24, 2014 – Emerging markets have become the center of attention when talking about present and future smartphone growth. According to the International Data Corporation (IDC) Worldwide Quarterly Mobile Phone Tracker, in 2013 the worldwide smartphone market surpassed 1 billion units shipped, up from 752 million in 2012. This boom has been mainly powered by the China market, which has tripled in size over the last three years. China accounted for one out of every three smartphones shipped around the world in 2013, equaling 351 million units.
Recently the surge in growth has started to slow as smartphones already account for over 80% of China’s total phone sales. The next half billion new smartphone customers will increasingly come mainly from poorer emerging markets, notably India and in Africa.
“The China boom is now slowing,” said Melissa Chau, Senior Research Manager for mobile devices at IDC Asia/Pacific. “China is becoming like more mature markets in North America and Western Europe, where smartphone sales growth is slackening off.”
Emerging markets in Asia/Pacific outside of China, together with the Middle East and Africa, Central and Eastern Europe, and Latin America, account for four fifths of the global feature phone market, according to IDC data. “This is a very big market opportunity,” said Simon Baker, Program Manager for mobile phones at IDC CEMA. “Some 660 million feature phones were shipped last year, which could add two thirds to the size of the current global smartphone market.”
India will be key to future smartphone growth as it represents more than a quarter of the global feature phone market. “Growth in the India market doesn’t rely on high-end devices like the iPhone, but in low-cost Android phones. Nearly half of the smartphones shipped in India in 2013 cost less than US$120,” said Kiranjeet Kaur, Senior Market Analyst for mobile phones at IDC Asia/Pacific.
“Converting feature phone sales to smartphone sales implies a relentless push towards low cost,” added Baker. IDC research shows nearly half the mobile handsets sold across the world have retail prices of less than US$100 without sales tax. Two thirds of those have prices of less than US$50.
“The opportunity gets larger the lower the price falls,” continued Baker. “If you take retail prices without sales tax, in 2013 nearly three quarters of the US$100-125 price tier was already accounted for by smartphones. Within US$75-100 the proportion was down to just over half, and between $50-75 it was not much more than a third.”
Many smartphone vendors have begun gearing up for this next wave of cost pressure. Samsung is increasingly switching production to Vietnam, where manufacturing costs currently undercut mainland China. Even Hon Hai, one of the largest contract manufacturers for handsets in China, has announced plans for a plant in Indonesia to furnish a lower production cost base.
In addition to the table below, an interactive graphic showing worldwide sub-$100 feature phone shipments by region is available here. The chart is intended for public use in online news articles and social media. Instructions on how to embed this graphic can be found by viewing this press release on IDC.com.
Worldwide Sub-$100 Feature Phone Shipments by Region, 2013
Region
Shipments (M Units)
India
212.3
Middle East & Africa
150.0
Asia/Pacific (excluding Japan, China, and India)
140.7
Latin America
76.4
PRC
68.1
Central & Eastern Europe
43.6
Western Europe
39.8
North America
13.9
Total
744.9
Source: IDC Worldwide Mobile Phone Tracker, February 24, 2014


Analysys International: Xiaomi Ranked Among Top Five in Q4, 2013 [March 11, 2014]
The statistics from EnfoDesk, the Survey of China Mobile Terminals Market in Q4, 2013, newly released by Analysys International, shows that the market share of Samsung, Lenovo, Huawei, Coolpad and Xiaomi ranked the top five of China smartphone in Q4, 2013. The market share of Samsung shrink slightly over the previous quarter, but it still accounted for 15.07 percent of smartphone market and maintain the leading position.
The release of Apple‘s new product has brought efficiency in Q4, and its market share slightly rebounded. Owning to the release of MI3 (Xiaomi), the market share of Xiaomi up 3.85 percentage points compared to the previous quarter. MI3 still should be bought from booking and the booking is relatively frequent. Meanwhile, the purchase restriction of MI2(Xiaomi) and Red MI(Xiaomi) has been relaxed, coupled with the strategic cooperation between Xiaomi and mobile operators, making it easier to buy custom models as well as contributing to the enlargement of Xiaomi’s market share. It can be expected that Xiaomi will put more energy into the complement of its retail capabilities and continue to increase their market share.
From: UMENG Insight Report – China Mobile Internet 2013 Overview [UMENG, March 12, 2014]
– The number of active smart devices in China exceeded 700 Million by the end of 2013.
– The five fastest growing mobile apps categories (excluding games) are : news, health & fitness, social networking, business, and navigation. These areas will bring new opportunities for developers in 2014.
– Socializing your apps is the key to success for developers. Currently among the top 1,000 apps (apps and games) in the Chinese market, 55% of them provide links to Chinese social networking services (e.g. Sina Weibo, Wechat, QQ, Renren) The amount of app content sharing to social network platforms per mobile Internet user per day has tripled in the last 6 months.
– Social network sharing in game has become incredibly popular on all social networking platforms, 48% of in app sharing traffic to social networks are from games.
– High-end devices (pricing above 500US$) have a significant market share in China, contributing 27% of total devices. These users have dynamic needs on mobile apps . The users of below 150US$ phones prefer casual games for their entertainment requirements.
– The year of 2013 became known as the first year Chinese developers took IP seriously with many developers licensing IP from rights holders. By the end of 2013, among the Top 100 games, 20% license 3rd party IP.
– Over the course of 2013 the percentage of iOS jailbroken devices in the Chinese Mainland fell by 17% to 13% of all devices. Domestic users are becoming more hesitant to jailbreak their devices.
…
700 Million active smart devices in China
…
The market for budget Android phones is strong in China with 57% of devices under 330 USD price range. However over a quarter of users are using high-end smart phones costing over 500USD, 80% of these are iPhones.
…
Fragmented Android device market
- In the 4th quarter of 2013, Samsung and XiaoMi (a local brand) prove to be the most popular Android brands as between them they manufacture all of the top 10 active Android devices.
- However the Android market is still highly fragmented with hundreds of different handsets on the market. Samsung who manufacture many devices in all price ranges control 24% of the device market, while the domestic manufactures are battling it out with the international brands to extend their market share.
…
- In 2013, changes to device connectivity saw a large growth in WiFi connectivity, from 38% at the beginning of the year to 52% at year end. Mobile Internet infrastructure has become better in China. However Chinese users are still price sensitive to mobile data tariff.


…
- Glossary:
Active Device: active device refers to device which has activated at least one app covered by Umeng platform in the stipulated time frame. All the “devices” in the report refers to “active devices”, not the actual shipment.…
- Data Source:
Analysis data in the report is based on over 210,000 Android and iOS apps from the Umeng platform. All data was collected from January to December 2013.

From: More than 247 million mobile handsets shipped in India during CY 2013, a Y-o-Y growth of 11.6%; over 70 million mobile handsets shipped in 4Q 2013 alone [CyberMedia Research press release, Feb 26, 2014]
According to CMR’s India Monthly Mobile Handsets Market Review, CY 2013, February 2014 release, India recorded 247.2 million mobile handset shipments for CY (January-December) 2013. During the same period, 41.1 million smartphones were shipped in the country.
…

India Smartphones Market
The India smartphones market during 2H 2013 saw a rise in shipments by 60.3% over 1H 2013, taking the overall contribution of smartphones to 16.6% for the full year. Further, 65.8% of the total smartphones shipped in the country were 3G smartphones during CY 2013.
Commenting on these results, Tarun Pathak, Lead Analyst, Devices, CMR Telecoms Practicesaid, “CY 2013 was primarily the year of smartphones for the India market, particularly for local handset vendors. A first for the India market was a marginal decline in featurephone shipments on a year-on-year basis. This trend is likely to continue with more vendors focusing on entry level smartphone offerings aimed at the consumer segment.”
“Nearly 70 vendors operated in the highly competitive India smartphones market in CY 2013, with ‘Tier One’ brands like Apple, Samsung, Nokia, Sony, HTC, LG and Blackberry capturing close to 53% of the total smartphones market, followed by India brands capturing close to 43% of total smartphone shipments. The remaining market of roughly 4% smartphone shipments was captured by China OEM brands, where we expect a few more players to enter the India market directly, instead of continuing as ODM partners to Indian brands”, Tarun added.

Rapid Growth In Smartphones Offset The Slump Witnessed In Feature Phone Sales In 4Q13, Says IDC [press release, Feb 26, 2014]
India was one of the fastest growing countries worldwide in terms of smartphone adoption in 2013. According to the International Data Corporation (IDC) in 2013 the smartphone market surpassed 44 million units shipped, up from 16.2 million in 2012. This surge has been mainly powered by home grown vendors which have shown a tremendous and consistent growth over the past 4 quarters of 2013.
The overall phone market stood at close to 257 million units in CY 2013 – an 18% increase from 218 million units in CY2012.
CY2013 also witnessed a remarkable migration of the user base from feature phones to smartphones primarily due to the narrowing price gaps between these product categories.
Q413 Perspective:
The India smartphone market grew by 181% year over year (YoY) in the fourth quarter of 2013 (4Q13). According to International Data Corporation’s (IDC) APEJ Quarterly Mobile Phone Tracker, vendors shipped a total of 15.06 million smartphones in 4Q13 compared to 5.35 million units in the same period of 2012. 4Q13 grew by almost 18% Quarter-on-Quarter.
The shipment contribution of 5.0inch-6.99inch screen size smartphones (phablets) in 4Q2013 was noted to be around 20% in the overall market. The category grew by 6% in 4Q13 in terms of sheer volume over 3Q13.
The overall mobile phone market (Feature Phones and Smartphones) stood at 67.83 million units, a 16% growth YoY and a meager 2% growth quarter over quarter (QoQ).The share of feature phones slid further to make 78% of the total market in 4Q13, with the market showing a decline of 2% in 4Q13 over 3Q13.

The fourth quarter of 2013 witnessed a spike in the smartphone shipments by smaller homegrown vendors like LAVA, Intex which have shown tremendous growth in the past couple of quarters.
“The growth in the smartphone market is being propelled by the launch of low-end, cost competitive devices by international and local vendors which are further narrowing the price gaps that exist between feature phones and smartphones”, said Manasi Yadav, Senior Market Analyst with IDC India.
“The international vendors have understood the importance of creating a diverse portfolio of devices at varied price points and are striving to launch cost competitive devices that cater to every segment in the target audience ” comments Kiran Kumar, Research Manager with IDC India.
Top Five Smartphone Vendor Highlights
Samsung: Samsung maintained its leadership spot with about 38% in terms of market share. Its smartphone shipments grew by close to 37% from 3Q 2013 to 4Q2013. The fourth quarter saw quite a few new launches across price points by Samsung – however the low-end Galaxy portfolio in smartphones contribute to 50% in terms of shipment volumes
Micromax: Micromax held on to its second spot with about 16% in terms of market share in 4Q2013. Some of the top selling models were the entry level smartphones like A35 Bolt and A67. The Canvas range of devices has also done well in terms of volume contribution owing to the marketing campaigns launched around them.
Karbonn: The market share for Karbonn in 4Q2013 was close to 10%, some of the top selling models for this brand were A1+ and A51.
Sony: Sony managed to make a comeback in the top-5 smartphone vendor list in 4Q13 and garnered a market share of 5%. The top selling models included Xperia M Dual and Xperia C handsets, which are targeted at mid-tier price range.
Lava : Lava managed to hold onto the number 5 spot in the top-5 smartphone vendor list. The continued traction around the XOLO and IRIS range of devices helped the vendor garner a market share of 4.7% in 4Q13. Some of the top selling models include the newly launched XOLO A500 S and the existing models like IRIS 402 and IRIS 349.

IDC India Forecast:
IDC anticipates the growth in Smartphone segment to outpace the overall handset market growth for the foreseeable future. The end-user shift towards mid-to-high screen size products will be amplified by the declining prices and availability of feature-rich localized product offerings. Vendors who are able to differentiate their offerings at affordable prices will maintain a competitive edge and secure a strong position in the mobile phone market in CY 2014.


From: Gartner Says Annual Smartphone Sales Surpassed Sales of Feature Phones for the First Time in 2013 [press release, Feb 13, 2014]
…
Worldwide Smartphone Sales to End Users by Vendor in 2013 (Thousands of Units)
Company
2013
Units
2013 Market Share (%)
2012
Units
2012 Market Share (%)
Samsung
299,794.9
31.0
205,767.1
30.3
Apple
150,785.9
15.6
130,133.2
19.1
Huawei
46,609.4
4.8
27,168.7
4.0
LG Electronics
46,431.8
4.8
25,814.1
3.8
Lenovo
43,904.5
4.5
21,698.5
3.2
Others
380,249.3
39.3
269,526.6
39.6
Total
967,775.8
100.0
680,108.2
100.0
Source: Gartner (February 2014)
Worldwide Smartphone Sales to End Users by Vendor in 4Q13 (Thousands of Units)
Company
4Q13
Units
4Q13 Market Share (%)
4Q12
Units
4Q12 Market Share (%)
Samsung
83,317.2
29.5
64,496.3
31.1
Apple
50,224.4
17.8
43,457.4
20.9
Huawei
16,057.1
5.7
8,666.4
4.2
Lenovo
12,892.2
4.6
7,904.2
3.8
LG Electronics
12,822.9
4.5
8,038.8
3.9
Others
106,937.9
37.9
75,099.3
36.2
Total
282,251.7
100.0
207,662.4
100.0
Source: Gartner (February 2014)
Top Smartphone Vendor Analysis
Samsung: While Samsung’s smartphone share was up in 2013 it slightly fell by 1.6 percentage points in the fourth quarter of 2013. This was mainly due to a saturated high-end smartphone market in developed regions. It remains critical for Samsung to continue to build on its technology leadership at the high end. Samsung will also need to build a clearer value proposition around its midrange smartphones, defining simpler user interfaces, pushing the right features as well as seizing the opportunity of bringing innovations to stand out beyond price in this growing segment.
Apple: Strong sales of the iPhone 5s and continued strong demand for the 4s in emerging markets helped Apple see record sales of 50.2 million smartphones in the fourth quarter of 2013.
“However, Apple’s share in smartphone declined both in the fourth quarter of 2013 and in 2013, but growth in sales helped to raise share in the overall mobile phone market,” said Mr. Gupta. “With Apple adding NTT DOCOMO in Japan for the first time in September 2013 and signing a deal with China Mobile during the quarter, we are already seeing an increased growth in the Japanese market and we should see the impact of the last deal in the first quarter of 2014.”
Huawei: Huawei smartphone sales grew 85.3 percent in the fourth quarter of 2013 to maintain the No. 3 spot year over year. Huawei has moved quickly to align its organization to focus on the global market. Huawei’s overseas expansion delivered strong results in the fourth quarter of 2013, with growth in the Middle East and Africa, Asia/Pacific, Latin America and Europe.
Lenovo: Lenovo saw smartphone sales in 2013 increase by 102.3 percent and by 63.1 percent in the fourth quarter of 2013. Lenovo’s Motorola acquisition from Google will give Lenovo an opportunity to expand within the Americas.
“The acquisition will also provide Lenovo with patent protection and allow it to expand rapidly across the global market,” said Mr. Gupta. “We believe this deal is not just about entering into the U.S., but more about stepping out of China.”
Gartner expects smartphones to continue to drive overall sales in 2014 and an increasing number of manufacturers will realign their portfolios to focus on the low-cost smartphone sector. Sales of high-end smartphones will slow as increasing sales of low- and mid-price smartphones in high-growth emerging markets will shift the product mix to lower-end devices. This will lead to a decline in average selling price and a slowdown in revenue growth.
In the smartphone OS market, Android’s share grew 12 percentage points to reach 78.4 percent in 2013 (see below). The Android platform will continue to benefit from this, with sales of Android phones in 2014 approaching the billion mark.
Worldwide Smartphone Sales to End Users by Operating System in 2013 (Thousands of Units)
Operating System
2013 Units
2013 Market Share (%)
2012 Units
2012 Market Share (%)
Android
758,719.9
78.4
451,621.0
66.4
iOS
150,785.9
15.6
130,133.2
19.1
Microsoft
30,842.9
3.2
16,940.7
2.5
BlackBerry
18,605.9
1.9
34,210.3
5.0
Other OS
8,821.2
0.9
47,203.0
6.9
Total
967,775.8
100.0
680,108.2
100.0
Source: Gartner (February 2014)
…
Microsoft’s integrated solution for streaming video and Live TV providers on all devices, plus the upcoming live-action and “shared experience” TV of its own on Xbox
This is my finding as an update to the one of a year ago in “Microsoft entertainment as an affordable premium offering to be built on the basis of the Xbox console and Xbox LIVE services [Feb 13, 2013] OR create interactive content as a premium offering together with partners using Kinect technology as a starter OR moving Microsoft Xbox 360 to ‘entertainment console’ OR leaving the good quality commodities to others and going for a premium brand with Xbox as well”.
One cannot understand the Microsoft solution without first looking at:
- Cable and satellite video market (U.S. only)
- Pay-TV market (cable and satellite, IPTV, terrestrial)
- The overall TV market (home video, on demand video, linear TV)
- IPTV—AT&T U-verse TV and Verizon FiOS video in particular
- OTT (Over-the-top content)
Then the Microsoft solution could be presented as follows:
6. Microsoft’s live TV solution on Xbox
7. Preliminary information on the upcoming products from Xbox Entertainment Studios
8. Xbox Music and Xbox Video services for other devices
Before all that, however, we should also understand a key trend that the Installed Base of Internet-Connected Video Devices to Exceed Global Population in 2017 [iSuppli press release, Oct 8, 2013] which is also showing the immense difficulty for the Microsoft effort:
More than 8 billion Internet-connected video devices will be installed worldwide in 2017, exceeding the population of the planet, according to research from the Broadband Technology Service at IHS Inc. (NYSE: IHS).
The installed base of video-enabled devices that are connected to the Internet—a category that includes diverse product such as tablets, smart TVs, games consoles, smartphones, connected set-top boxes, Blu-ray players, and PCs—will expand to 8.2 billion units in 2017. This will represent a nearly 90 percent increase from 4.3 billion in 2013, as presented in the attached figure.
With the world’s population amounting to 7.4 billion people in 2017, this means that there will be 1.1 Internet-connected video devices installed for each global citizen.

“On average every human being in the world will possess more than one Internet-connected video device by the year 2017—a major milestone for the electronics market,” said Merrick Kingston, senior analyst, Broadband Technology, at IHS. “In practice, ownership of Internet-connected hardware will be concentrated among users whose homes are equipped with broadband connections. We’re quickly approaching a world where the average broadband household contains 10 connected, video-enabled devices. This means that each TV set installed in a broadband-equipped home will be surrounded by three Internet-connected devices.”
Asia-Pacific gets connected
The number of connected devices in the mature North American and Western European regions will grow at a relatively modest compound annual growth rate (CAGR) of 10 percent from 2013 to 2017.
In contrast, Asia-Pacific will expand at 20 percent during the same period. Driven largely by Chinese demand, Asia-Pacific will add 1.9 billion connected devices to the global installed base between 2013 and 2017.
On the other end of the regional spectrum, sub-Saharan Africa will contribute 145 million net additions to the total installed base during the next four years.
Challenges and opportunities
In order to cash in on this massive growth in Internet-connected devices, media companies across the operator, broadcast, consumer electronics manufacturing and over-the-top (OTT) businesses have embraced Internet protocol (IP) video distribution. Big names making a foray into IP video include HBO, Microsoft, DirecTV and Netflix.
However, all of these companies face a major challenge: how to wrap consumers into their ecosystems, given the proliferation of platforms, high switching costs and strong incentives for consumers to stay with their existing services.
Back in 2005, PCs comprised 93 percent of all connected devices. By the end of 2017, the base of connected devices will diversify dramatically, with PCs comprising only 23 percent of the connected installed base. Other devices will account for the rest of the market, including smart TVs at 5 percent, consoles at 2 percent, and smartphones and tablets collectively representing 67 percent.
“Addressing the full breadth of the device landscape, and recuperating the development cost of doing so, will pose a major challenge for a number of media firms,” Kingston added.

1. Cable and satellite video market (U.S. only)
Let’s start with a list of cable and satellite video providers in the U.S.:

The chart is from Would a DirecTV-DISH Merger Still Make a New Pay-TV Media Monopoly?
[24/7 Wall St., Oct 10, 2013]. Note that Newco is the DirectTV-DISH merged company
just imagined by the article. The actual Top 5 companies represented 75.4% of the U.S.
cable and satellite video subscribers: 35.6% satellite (newco) and 39.8% cable.
Relative to that Verizon FIOS video IPTV had 4.7M subscribers and
AT&T U-verse [IP]TV 4.5M by the end of Q4’12 (see below).

See also (in order to understand the challenges cable operators are facing everywhere):
– TWC rebuffs Charter’s latest takeover bid [[IHS] Screen Digest commentary, Jan 14, 2014] with “The saga to create the nation’s second largest cable operation is moving into a new phase … With so many sharks circling TWC, IHS believes that it will be a matter of not if but when TWC accepts a bid.”
– Time Warner Cable prepares for its business future [[IHS] Screen Digest commentary, Oct 8, 2013] with “TWC and other cable operators are in the unenviable position of seeing their primary product, pay TV video, declining. Coupled with encroachment from IPTV, and potential upstart OTT technologies, cable operators are pushing to grow other business lines. … Staying ahead of the technological curve is a problem for all pay TV operators, and cable more than IPTV, with Satellite experiencing the worst of it.”
– Netflix added to Virgin’s TiVo platform [[IHS] Screen Digest commentary, Sept 10, 2013] with “UK cable company Virgin Media has signed what is effectively an OTT carriage deal with Netflix to bring the streaming service onto the Virgin TiVo platform. Groundbreaking move is the first deal of its type and indicates a change in the positioning of Netflix and the competitive positioning of OTT against ‘traditional’ pay TV. … that more firmly positions Netflix as a content aggregator (read: channel) rather than a platform and opens the door for similar deals internationally. Move vindicates our long-held view that this was the correct way to position Netflix and other OTT content aggregators.”
Cable takes the fight to OTT [[IHS] Screen Digest commentary, Oct 28, 2013]
After years of subscriber losses, Comcast announced on October 25, 2013, the first widespread test of a cable network lite bundle, the combination high-speed data (HSD) and broadcast basic video and premium channel. The trial is slated to run a minimum of one year, the operator plans to have stepped increases in the starter $49.99 per month price at 6 months ($60-$70) and again at one year ($70+).
This is not the first such offering however. In August of 2013 Time Warner Cable (TWC) initiated a similar promotion targeted at transitioning college students back toward video products, including HBO and HSD. TWC partnered with nine colleges in this limited trial, again the term is likely to run for a year or less. TWC is charging $79.99 per month for one year, but did not list a non-promotional price.
In the following analysis IHS makes two assumptions: 1) That cord-cutting and cord-never households will likely buy HSD from pay TV providers, and that it will skew toward higher speed tiers. 2) The price for bundled 25-30Mbit is ~$55 and unbundled ~$60.
Our take
The fact that the business of pay TV is changing is no longer in doubt, but the business has insulated itself well and is preparing to weather the storm. Comcast and TWC are not the first to experiment with new offerings, Cox recently concluded its flareWatch trial, the first pay TV OTT trial. The difference between the Cox effort and Comcast and TWC is that the two latter companies have price efficiencies working on their side.
That’s not to say that IHS believes that the Cox trial was ended because of price, more likely Cox received valuable customer feedback and experience. The Comcast and TWC deals are predicated on completely different foundations. Both offerings provide significant perceived value, and combined monetary value to subscribers.
Both deals compare to a HSD and Netflix and/or Hulu+ plan. The Netflix/Hulu+ plan will likely cost $68 to $76 depending upon HSD tier and number of OTT subscriptions, compared with Comcast’s year one monthly average of $60 and TWC’s $70. Another significant point of difference is the depth of offering.
Both pay TV providers share four common features, 25-30Mbit HSD, local broadcast channels, HBO, HBO GO – Comcast also includes StreamPix (Library title Subscription VOD). IHS believes that both Comcast and TWC are at a minimum matching Netflix on a like-for-like price content offering when considering HSD and HBO versus HSD and Netflix/Hulu+. The addition of broadcast local channels as well as SVOD in the case of Comcast, signal that cable is not going to give up the fight.
2. Pay-TV market (cable and satellite, IPTV, terrestrial)
Then, according to Worldwide pay-TV Subscribers to Exceed 1.1 Billion in 2019 with Increasing IPTV Market Share [ABI Research, Jan 22, 2014]
Worldwide pay-TV market reached 903.3 million subscribers in 2013, generating $249.8 billion in service revenue. IPTV operators enjoyed significant growth (18.5% YoY) in 2013 to 92 million subscribers with a total of $37.2 billion in service revenue.
“Increasing FTTH [Fiber To The Home] subscriber base and bundled subscriber base of telcos are boosting the IPTV market. ABI Research forecasts that the IPTV subscriber base will grow to 161 million subscribers in 2019 accounting for 15% of overall pay-TV market,” comments Jake Saunders, VP and practice director of core forecasting.
The global terrestrial TV market reached 9.5 million subscribers at the end of 2013. A declining pay DTT subscriber base in Italy and Spain had an impact on the overall Western European DTT market which dropped around 5% in 2013. Unlike Western Europe, the DTT market in Africa grew a remarkable 45% to 2.1 million subscribers in 2013. “As African countries start to switch over to digital, digital terrestrial TV has become an affordable alternative to satellite TV service in the region. ABI Research forecasts that Africa will have over 4.8 million DTT subscribers in 2019,” adds Khin Sandi Lynn, industry analyst.
DirecTV maintains its largest market share in terms of pay-TV service revenue. The company had around 20.2 million subscribers in the US with an ARPU above $102 by the end of 3Q-2013. Globally, the pay-TV market is expected to grow to 1.1 billion subscribers with $320.3 billion in service revenue in 2019.

3. The overall TV market (home video, on demand video, linear TV)
Or a broader view representing all other segments of the TV market as well:
Global TV market revenue to grow at a steady pace: up 23% by 2018
[DigiWorld by IDATE blog, Jan 30, 2014] by Florence Le Borgne
Head of the TV & Digital content Practice, IDATE.
At a time when video has become pervasive across all of our screens, most national TV markets are losing steam: shrinking viewership and pressure on advertising markets, especially in Europe. Although pay-TV seems to be holding its own, the fast-growing popularity of OTT offerings is shaking up the traditional pay-TV model, while the demise of physical media is virtually a foregone conclusion.
If the decline of physical media now seems inevitable, television still has a chance to reinvent itself in a way that takes into account changes in viewer behaviour and competition from new online vendors.
Accessing TV
According to IDATE, the number of TV households worldwide will reach 1.675 billion in 2018 (+9.6% in 5 years), with the number of digital TV households worldwide being 1.542 billion in 2018, which translates into 92% of TV households
Cable will the remain the chief access channel (592.3 million households in 2018) but will gradually lose ground to satellite and IPTV which will account for 32.9% and 10.9% of TV households, respectively, at the end of 2018.
Despite the development of hybrid TV solutions, terrestrial TV should continue its decline on the first TV set and drop down to number three spot by 2018, with roughly 21% share of the global market.
The development of hybrid solutions that combine live programming on broadcast networks (terrestrial and DTH) and OTT video services over the open Web is a key variable in the future development of the various TV access modes, and may well shake up current trends.
TV: top money-maker
Breakdown of audiovisual market revenue in 2013

TV revenue
According to IDATE, the global TV industry’s revenue will come to €374.8 billion in 2013 and €459.2 billion in 2018.
Pay-TV revenue will grow by 21.3% between 2013 and 2018, or by an average 3.9% annually, to reach €220.2 billion in 2018.
Ad revenue will enjoy even stronger growth of 27.3% between 2013 and 2018, to reach €201.1 billion in 2018.
Public financing/licensing fees will continue to increase significantly (+7.7% in 5 years) to reach nearly €38 billion in 2018.
Video revenue
According to IDATE, physical media sales will total €16.3 billion in 2018, when video on demand (VoD) revenue will reach €35.4 billion in 2018, which is 90% more than in 2013.
This means that the global market will have shrunk to more than a quarter of what it was in 2013 (-27.2%).
Blu-ray will be the most common format and help temper plummeting physical media sales.
OTT video will continue to be the biggest earner, generating 51% of total revenue.
VoD will still be the dominant model on managed networks. It will generate €6.9 billion in 2018 versus €2.3 billion for subscription video on demand (S-VoD).
American OTT video providers’ footprint in Europe as of 31 December 2013
Source: IDATE, December 2013American OTT vendors already have a solid foothold in Europe
Netflix is already present in seven European countries: Britain, Ireland, the Netherlands, Denmark, Norway, Finland and Sweden. The service had 1.6 million subscribers in the UK and Ireland at the end of 2013.
LoveFilm was reporting 1.9 million subscribers in the UK and Germany at the end of 2013.
At the end of 2013, iTunes’ VoD rental service was available in close to 110 countries, and permanent downloads in 14 countries, chiefly in North America and Europe.
More information on TV and new video services market report & database

UK Video Rental Market Plunges in 2013 as Half of Country’s Blockbuster Stores Close [IHS iSuppli press release, April 23, 2013]
The market for Blu-ray (BD) and DVD rental in the United Kingdom is expected to plunge by 22 percent in 2013, as half the country’s Blockbuster video stores shut down in a restructuring initiated by the company’s new management.
The U.K. market for physical-video rental will drop to £202 million in 2013, down £57 million, or 22 percent from £259 million in 2012, according to a newly updated forecast from IHS (NYSE: IHS) . While the market is generally on the decline, 2013 will bring the sharpest predicted annual decrease for the 11-year period from 2007 through 2017.
By the end of 2013, only 264 Blockbuster stores will be open in the country, down 50 percent from 530 in 2012. Blockbuster is the largest video rental chain in the country.
“The year 2013 is set to become a watershed for the U.K. video rental market as a result of the wholesale closure of Blockbuster UK stores,” said Tony Gunnarsson, senior video analyst at IHS. “The massive downturn in the store-based video rental market represents a significant loss to the video market and will result in a major decline and radical transformation of the U.K. video market overall. From 2013 on, the U.K. physical-video rental business increasingly will be dominated by online rent-by-mail subscription services.”
Both DVD and BD transactions are due to decrease across the store-based sector this year. DVD rentals will fall by a steep 53.2 percent to 15.4 million. BD is set to drop by an even larger 61.3 percent to 2.8 million respectively.
Blockbuster gets busted up
After filing for administration in January 2013, Blockbuster’s administrators Deloitte announced two separate rounds of store closures, including some 224 sites. In February 2013, supermarket chain Morrisons purchased 49 of these former Blockbuster stores in its drive to increase its store presence in southeast England.
Out of the remaining Blockbuster stores, Gordon Brothers acquired a total of 264 locations, including a number of Blockbuster outlets earmarked for closure that will now remain open.
Pay-TV killed the video store
In 2012, rental stores were responsible for 41.3 percent of the video rental market based on consumer spending. In the latest forecast for 2013, however, the store-based sector is now projected to generate just 24.7 percent of the overall market. This tilts the market toward the online sector, which will see its share of market increase massively from 58.7 percent in 2012 to 75.3 percent this year.
At the same time, the lost rental business won’t result in customers that used to rent at Blockbusters automatically signing up to become rent-by-mail customers with online providers, IHS believes. Rather, those customers are more likely to turn to a host of other video platforms, primarily pay-TV services.
Video rental market winds down
In the longer view, the U.K. rental market will return to a normal trend of decline after 2013, with spending on renting physical video shrinking at an annual rate of under 5 percent until 2017. By then, the retreat in spending is expected to be slightly more negative at 7 percent.

4. IPTV—AT&T U-verse TV and Verizon FiOS video in particular
As far as the U.S. is concerned AT&T U-verse TV and Verizon FiOS video are the leading IPTV services by far*, having 5.5 million and 5.3 million subscribers respectively, which is 11.7% of the above 92 million subscribers number by ABI Research:
 * The next service provider, CenturyLink “Ended the quarter with 149,000 CenturyLink® PrismTM TV subscribers, an increase of approximately 17,000 subscribers in third quarter 2013” according to its Q3 203 report [Nov 6, 2013]. CenturyLink only entered five U.S. markets after acquiring Embarq (2009) and Qwest (2010). In fact no other U.S. providers are in the Top 20 globally according to SNL Kagan Reports World’S 20 Largest IPTV Operators Served 83% of Global IPTV Households at End-2012 [June 6, 2013]. More:
– China’s leading telcos– China Telecom and China Unicom– serve an estimated 30% of the global IPTV subscriber base.
– Asian telcos accounted for 49.2% of the top 20’s IPTV subscribers in 2012, reflecting the region’s large market size and limited telco competition.
– France — the second-largest IPTV market by subscribers after China — is home to four operators ranked among the global top 20. [Note that among Top 5 are Iliad and France Telecom. Iliad’s Freebox TV offering proposes a broad selection of TV channels (over 450, of which more than 200 are included in the basic package), as well as numerous audiovisual services, such as catch-up TV (with 45 channels available on Freebox Replay), and a wide video-on-demand offering. It was actually the largest IPTV deployment in the world with 2.4 million IPTV-enabled customers as of end 2007 (see here).]
– Nine operators out of 20 are located in Western Europe and seven in Asia.

U-verse® Drives Wireline Consumer Growth and Broadband Gains
- Wireline consumer revenue growth of 2.9 percent versus the year-earlier period
- Total U-verse revenues, including business, up 27.9 percent year over year, now a $13 billion annualized revenue stream
- 10.7 million total U-verse subscribers (TV and high speed Internet) in service:
- 630,000 high speed Internet subscriber net adds; record annual net adds of 2.7 million
- 194,000 U-verse TV subscribers added, lowest churn in product history
- Continued U-verse broadband gains in the business customer segment, up 78,000, nearly doubling year-ago net adds
- Strategic business services growth accelerates with revenues up 17.4 percent year over year, now more than 25 percent of wireline business revenues
…
Record-Low U-verse TV Churn. Total U-verse subscribers (TV and high speed Internet) reached 10.7 million in the fourth quarter. U-verse TV had the lowest-ever churn in its history. U-verse TV added 194,000 subscribers in the fourth quarter with an increase of 924,000 for the full year to reach 5.5 million in service. AT&T has more pay TV subscribers than any other telecommunications company.
…U-verse TV penetration of customer locations continues to grow and was at 21 percent at the end of the fourth quarter.
- From AT&T Fourth Quarter 2013 Earnings Slide Presentation [Jan 28, 2014]

Note that after AT&T Extends TV Watching to More Devices with Launch of U-verse TV on Xbox 360 [press release, Oct 11, 2010] and even after New U-verse Internet Customers Can Take Their Pick: A Free Xbox 360, SONOS PLAY:3, Kindle Fire or Nexus 7 Tablet [press release, March 18, 2013] that Xbox tie-up ended with AT&T U-verse TV To Drop Support For Xbox 360 on December 31 [Multichannel, Nov 26, 2013]:
“We’ve made this decision due to low customer demand,” an AT&T spokeswoman said via email on Tuesday. AT&T declined to say how many customers currently use the Xbox 360 as a set-top. … AT&T, the spokeswoman added, currently has no plans to support U-verse TV on the Xbox One. Verizon Communications FiOS TV is the first, and so far only, U.S. pay-TV provider to offer an authenticated app for the Xbox One during its initial launch phase.
- From Verizon 4Q 2013 Quarter Earnings Conference Call Webcast [Jan 21, 2014]materials:
In FiOS video we added 92,000 new subscribers in the quarter. Total FiOS videos customers reached 5.3 million, representing 35% penetration.
…
As far as the OnCue acquisition [from Intel, i.e. the Intel Media operation], look, the focus here is really to accelerate the availability of the next-generation IP video service which we will integrate into the FiOS video service. And really what we are trying to do is differentiate this even more so with fiber to the home versus others with the TV offerings and reducing the deployment costs. And this really accelerates us from if we were trying to build IP TV versus buying the IP TV technology.
From an FiOS customer perspective, we expect the benefits that they will have more elegant search and discovery activity and cost stream ease of use. But also keep in mind, with the acquisition of Verizon Wireless and becoming 100% ownership of that we also plan to take that platform and integrate it more deeply with our Verizon Wireless 4G LTE network. So that really was the strategy behind this.
As far as would we enable this platform to take us over the top, obviously we have our video digital media services that we have been working on for 2.5 years. We’ve just made two acquisitions related to that platform. So, look, we are positioning ourselves strategically to be in a position to competitively compete around the whole mobile first world and video, so I think that is where we are.

Pay-TV Operators Can Stave Off OTT Threat with Multiscreen and CDN Investments [iSuppli press release, April 17, 2013]
Despite the dire competitive threat posed by over-the-top (OTT) services, pay-TV operators can thrive by investing in additional service offerings that should include multiscreen services to more than make up for the erosion in their customer base, according to the IHS Screen Digest TV Intelligence Service from information and analytics provider IHS (NYSE: IHS).
Speaking here today at the IHS PEVE Entertainment 2013 Conference, Guy Bisson, research director for television at IHS, noted that although European cable operators have lost 1.4 million households, they have gained 17.8 more revenue-generating units (RGUs), during the five-year period from 2007 through 2012.
While cable operators in Europe and other regions are expected to lose more households in the coming years, RGUs will continue to increase, driving revenue growth for the industry. The below figure presents the IHS history and forecast of cable households and RGUs for the 27 countries of the European Union.
5. OTT (Over-the-top content)
OTT and IPTV Integration Increasingly Popular [Pyramid Points, Nov 27, 2012]
How do you plan to spend your evening most times when you order a pizza? You’re very likely to watch a video.
In the UK, Domino’s Pizza Group saw the value of over-the-top (OTT) online video to boost customer loyalty, and back in October launched the Domino’s Pizza Box Office video streaming offer. Customers order a pizza and get a download code to stream a movie at home. This is just another example of how OTT is revolutionizing the way video content is delivered to consumers: Today almost anyone can become a content provider.
Exhibit: Evolving video delivery environment and video platforms
Source: Pyramid Research
Many operators see the proliferation of OTT as a threat to their established IPTV business models. They fear that OTT will subvert their role in the pay-TV value chain and cannibalize revenue. We’ve found, however, that the opposite is just as likely to be true. In our new report, “OTT Growth Sparks Innovation Multiscreen Video Business Models,” we argue that OTT is serving as an innovation stimulus for the pay-TV market, pushing telcos to enhance their IPTV services with more screens. We also find that an increasing number of operators, alongside their managed IPTV services, are directly entering into non-managed OTT environments. This means that more operators are using the open Internet to offer video services to potentially any consumer with a broadband connectivity, being their existing customers or not.
OTT in emerging markets: Challenges and opportunities
Operators are warming up to the idea of launching their own OTT services, especially in emerging markets. While IPTV remains a premium service, which requires subscribers to purchase more expensive bundles, OTT is more flexible and only requires a good broadband connection. This means that in the more price-sensitive markets, where there is still strong demand for online video, OTT is becoming an attractive option for users. Besides, OTT services are typically delivered over a wide range of screens and at different price points, including smartphones, tablets and gaming consoles, making them more accessible to different consumer profiles.
In Colombia, for example, ETB has announced that it will shortly launch an OTT service to complement its upcoming IPTV deployment. In Mexico, the OTT service provided by fiber-to-the-home (FTTH) operator Totalplay, dubbed Totalmovie, has rapidly become the main competitor to Netflix. It offers video content in Mexico alongside the operators’ IPTV platform and across Latin America by using third-party operator infrastructure. As of October, it had 1.9m registered users and 5m unique monthly visitors.
We expect to see more Latin American operators launching OTT services. The second largest regional group, Telefonica, is considering positioning OTT commercial offers in several countries. The decision between managed (IPTV) or unmanaged video delivery (OTT) ultimately depends on each country’s infrastructure, competitive environment and operator position. Telefonica has, however, confirmed that there are already ongoing OTT initiatives outside Spain.
In Turkey, TTNET, the ISP of fixed-line incumbent Turk Telekom, has already been quite successful in combining its IPTV and OTT offerings. TTNET wants to add value to the bundles, which in turns helps increase customer loyalty and reduce churn. This is crucial in preventing the decline of Turk Telekom’s fixed-line base. While IPTV is positioned as a premium service, OTT is priced very competitively. As of August this year, TTNET had over 1.2m OTT and 150,000 IPTV subscriptions.
OTT can provide significant benefits to operators. In the case of TTNET, positioning OTT alongside IPTV is encouraging consumers to break through their broadband allowances, thus creating the need to migrate to higher-value packages. In the case of Totalplay in Mexico, OTT is contributing to the monetization of the operator’s superfast fiber-based network. For both operators, using third-party infrastructure breaks the link between content delivery and network management.
The outlook is positive
In the near future, we expect to see significant revenue-generating opportunities associated with VoD, catch-up TV, and targeted advertising, especially when telcos can integrate their OTT and IPTV offerings with interactive and social media functions.
Using the open Internet for content delivery, however, has its downsides. The main shortcoming with OTT is that the operator is not in control of quality of service (QoS). Especially in emerging markets, quality of service and network speeds vary wildly from country to country, making it challenging to ensure the same quality of experience (QoE) that can be guaranteed through a managed IPTV network. Another challenge for operators is securing in-demand content for OTT platforms. Without doubt content is king, but content is also costly. Unless they are backed by multimedia and broadcasting groups, operators tend to be the weak link in the content production and delivery value chain. But that is a challenge with IPTV too.
All in all, if telcos are serious about developing a pay-TV offering that can resonate with the demand for multiple viewing platforms at different price levels, they need to seriously consider the opportunity of complementing IPTV platforms with OTT.
— Daniele Tricarico, Analyst

More information from Pyramid Research:
– Is the Arab World Ready for OTT Video? [Sept 13, 2013]
– CDNs Offer New OTT Revenue Hope [Feb 20, 2013]
– Chinese Regulator Opens Up to MVNOs [mobile virtual network operators] [March 15, 2013]
Finally here is a list of Top 10 Online Streaming Video Services [tom’sGUIDE, Jan 1, 2014] in the U.S. in order to understand the state-of-the-art of OTT video services:
Digital video options
Streaming video has just about displaced the DVD on the list of home entertainment options, and it may supersede cable and broadcast TV in the near future. Every modern computer has access to streaming video services, as do most game consoles and mobile devices, and even a growing proportion of televisions. Whether you’re looking to get your feet wet or expand your streaming horizons, check out 10 of the best services for watching movies, TV, music videos, Web shows and more.

Netflix
Netflix is the most popular video streaming service out there, and with good reason. The service is available on just about every platform, including computers, game consoles, set-top boxes and mobile devices, and it hosts movies and TV shows to accommodate every taste. From hit films like “The Avengers” to every “Star Trek” TV series to original programming like “Orange Is the New Black,” Netflix’s variety of content is unparalleled. You can even share an account among five different users to keep recommendations and viewing habits separate. Netflix costs $8 per month.
Inserts of mine:
– Netflix added to Virgin’s TiVo platform [[IHS] Screen Digest commentary, Sept 10, 2013] with “UK cable company Virgin Media has signed what is effectively an OTT carriage deal with Netflix to bring the streaming service onto the Virgin TiVo platform. Groundbreaking move is the first deal of its type and indicates a change in the positioning of Netflix and the competitive positioning of OTT against ‘traditional’ pay TV. … that more firmly positions Netflix as a content aggregator (read: channel) rather than a platform and opens the door for similar deals internationally. Move vindicates our long-held view that this was the correct way to position Netflix and other OTT content aggregators.”
– Netflix passes 38m paying ‘streaming’ subscribers [[IHS] Screen Digest commentary, Oct 22, 2013] with:
Netflix’s total number of paid streaming subscribers increased by 2.4m over the quarter, to reach 29.9m subscribers in the United States and 8.1m subscribers internationally. The international streaming service saw a larger than expected increase of free trialists to 1.1m driven by Latin America and the September launch of the service in the Netherlands.
The third quarter of 2013 is a significant milestone for Netflix, as the quarter in which the Netflix US streaming subscriber count pulled even with the US subscriber count of pay TV giant HBO. The company ended the quarter just shy of 30 million streaming subscribers with estimates for HBO at roughly the same level.
The comparison with HBO is the most appropriate for companies such as Netflix, Amazon and Hulu‘s subscription service, rather than with the pay TV operators. Netflix, as well as Hulu Plus and Amazon, are acting as premium channels in investing in acquired and original content and following in HBO’s early-1990s footsteps. Despite the investment Netflix has made in its own original programming, the company has reported that a greater percentage of overall viewing on the platform is of previous-season TV episodes and catalogue movies. Netflix indicates that it plans to double its investment in original content in 2014, although this will still represent less than 10per cent of global content expenditure.
…
Netflix’s international business remained a loss-making venture as the company struggles to gain profitability without scale and without a legacy high margin physical business. Whereas in the US the company initially bundled its streaming proposition with disc rentals add value to the physical subscription Netflix has not had a preexisting business from which to launch a digital subscription internationally. At present, the international ventures are subsidized by domestic market return and with ongoing market expansions planned by Netflix; IHS does not expect this to change in the mid-term.
End od my inserts for Netflix
Hulu Plus
If you want to catch TV shows almost as soon as they air, Hulu Plus may be right for you. This streaming service hosts a plethora of TV shows and movies. Whether you want to watch “Leverage,” “Family Guy” or “Spongebob Squarepants,” Hulu generally posts new episodes within days of their airing on TV. Hulu Plus costs $8 per month (with some shows available only on computers for free), and provides past seasons of shows along with Hulu’s original programs. It is available on computers, game consoles, streaming boxes and mobiles.
Amazon Prime Instant Video
Amazon Prime Instant Video is a streaming service that comes with an Amazon Prime subscription. In addition to offering free shipping on Amazon orders and free Kindle books to borrow, Amazon Prime allows subscribers to access approximately 40,000 movies and TV shows. In addition to unlimited streaming offerings, users can rent and buy other TV shows and movies a la carte. This makes Amazon Instant Video a good choice for watching newer movies before they touch down on unlimited streaming services like Netflix. Amazon Prime costs $79 per year.
See also: Amazon may hike Prime cost as earnings disappoint and further challenges lay ahead of the company for which it needs to adjust its business model and expand its operations [‘Experiencing the Cloud’, Jan 31, 2014]
M-Go
If you’re not interested in paying a monthly fee for your streaming video content, M-Go might be up your alley. M-Go, which is the default streaming service on Roku boxes and also available on computers and mobile devices, allows you to rent and buy TV shows and movies. Prices range from $2 for individual TV episodes to $20 for HD movie purchases. M-Go excels in offering both HD and SD versions of content, making it an attractive choice if you want a one-off rental.
Blip
Watching big-budget movies and TV is all well and good, but for curated, original Web shows from charismatic creators, nothing fits the bill like Blip. Think of Blip as a more curated, creator-friendly version of YouTube. Individuals create and upload original series, ranging from comedy to reviews to funny pet videos, and Blip ensures that the content has professional production values and that new entries are added regularly. All content on Blip is free, and you can access it via your computer, mobile device or Xbox 360.

Vevo
MTV hasn’t played music videos since the ’90s, but the medium is not dead just yet. Vevo hosts the latest music videos from artists ranging from Katy Perry to Old Crow Medicine Show, but audiophiles would be wise to stick around for its scads of original content. Users can access biographies, retrospectives, behind-the-scenes footage and interviews about their favorite musicians, and curated playlists for both individual artists and entire genres. Vevo is free, and available on computers, mobile devices, Rokus, Apple TVs and Xbox 360s.
MLB.TV
If you’re a baseball fan, you’re in luck: Major League Baseball‘s streaming service is one of the best in professional sports. MLB.TV allows viewers to watch most games during the regular MLB season. (Postseason games are available through the Postseason.TV service at additional cost.) Fans can watch both home and away games from anywhere in the world. Stat junkies can examine each pitch as it happens and compare their fantasy teams in real time. MLB.TV costs $130 per year and is available on computers, mobile devices, set-top boxes, Xbox 360s and PS3s.
Crackle
If you crave pop cinema, Crackle could be the best thing to happen to your TV since afternoon basic cable. The Crackle service offers a rotating selection of a few hundred movies and TV shows, including “Ghostbusters,” “The Cable Guy” and “The Shield.” Crackle also creates and hosts original content, ranging from espionage thriller serials to “Comedians in Cars Getting Coffee” starring Jerry Seinfeld. Crackle is free (though you’ll have to watch some commercials) and available on computers, mobile devices, set-top boxes and game consoles.
Twitch
Watching other people play video games is, surprisingly, almost as much fun as playing yourself — sometimes more so, if you have a good host. Twitch is a platform for gamers to livestream their play sessions. You can find streams of everything from “League of Legends” to “Minecraft.” Whether you want to see tutorials, speed runs or popular Web personalities’ reviews, Twitch has you covered. The service is free, both to watch and to stream your own sessions. Twitch is available on computers, mobile devices, set-top boxes and PS4s.
YouTube
The biggest video streaming service online is just about unbeatable when it comes to variety of content. YouTube is the go-to site to upload short videos: cats, clips from your favorite TV programs, cats, original Web shows, cats, movie trailers, cats and more. The service will be one of the first to support content for the higher-resolution 4K TVs. If you’re looking to watch short-form videos, this is the place to start. YouTube is free and available on just about every device with a screen and an Internet connection.
Discovery to take majority control of Eurosport [[IHS] Screen Digest commentary, Jan 22, 2014]
Discovery Communications has agreed to take a controlling interest in Eurosport International, the pan-European sports channel, from its partner TF1 Group [of France]. … Discovery, which primarily operates a portfolio of factual channels in Europe, has branched out in recent years with the acquisitions of SBS Nordic in Scandinavia and Italy’s Switchover Media. It now has the option to acquire 100% of Eurosport International and could also increase its interest in Eurosport France, though TF1 expects to retain its 80% interest until at least 1 January 2015.
…The US group‘s move to take control of Eurosport is, as the company noted yesterday, taking place a year sooner than originally planned. While sports is clearly a new playing field for Discovery, the male-skewing profile of Eurosport is a good fit with its factual channel brands, offering possibilities for combining advertising and network sales. To date, co-operation has focused on markets where Eurosport is not present, notably the US and China. In the US, Discovery has been showcasing Eurosport rally and superbike programming on its Velocity channel.
A further move into the US appears unlikely given the presence of ESPN and powerful rivals like Fox Sports, NBC Sports and CBS. Fox Sports in particular has recently made strong moves into the international market place. Outside the US, Eurosport successfully occupies a niche where it is not competing with premium pay operators like BSkyB, Canal Plus and Sky Italia for high cost events like league football, but instead focuses on lower profile events where rights are often shared with local free-to-air broadcasters.
The main uncertainty over Eurosport’s change of ownership surrounds its content supply from the European Broadcasting Union (EBU), which provides hundreds of hours of events like cycling, grand slam tennis, winter sports and athletics. TF1 is an EBU member, but with Discovery holding the reins, this arrangement will almost certainly have to be renegotiated, with possible implications for Eurosport’s cost base. Even now, there appears to be room for improvement: Discovery’s operating margin for its international operations was 44% in 2012, compared to a slender 14% for Eurosport International.
Sky sees future in OTT as upsell becomes focus [[IHS] Screen Digest commentary, July 26, 2013]
Sky [more precisely BSkyB] added more Now TV customers in the quarter to end June 2013 than new satellite customers and is increasingly pushing OTT access and connected devices as the core of its future growth strategy. In calendar second quarter (Sky’s fiscal Q4), the pay TV provider added 34,000 new TV customers to reach 10.442m and said the ‘bulk’ of TV growth came from OTT service Now TV. Organic growth for broadband stood at 119,000 (25 per cent more than BT added in the same quarter) with a further 400,000 added through the acquisition of O2’s UK broadband operations to reach 4.9m. Telephony grew 140,000 organically with 153,000 coming from O2 to reach 4.5m. The number of HD subscribers grew 117,000 to reach 4.789m or 46 per cent of the TV base, with 2.7m HD boxes connected to broadband. Annualised ARPU hit £577 up £29 in the year.
Sky said that its future strategy would focus on becoming the centre of the connected home across a range of content windows that would increasingly include DVD window for paid on-demand and movie retail as well as the traditional subscription window. The move comes on the back of impressive figures for on-demand and OTT content subscription with a three fold increase in Sky Store (on-demand) revenue and 166,000 customers paying £5 a month for the Sky Go Extra service that allows content download to mobile devices. Sky said that, on average, Sky homes have seven connected devices and that content access inside and outside the home was increasingly important to its offer. The operator said it had concluded four new studio deals with a wider range of rights to service this market and would prioritise getting its customer base connected. The new Sky HD box now comes with built in Wi-Fi and a new low-cost wireless connector is being made available. Sky also released a new Now TV box priced at £9.99 when a Now TV subscription is taken, the device also enables Smart TV functionality and is targeted at the 13m Freeview [a free-to-air digital terrestrial television service in UK, a joint venture between the BBC, ITV,Channel 4, BSkyB and transmitter operator Arqiva] homes who don’t currently subscribe to Sky services.
Our take
The latest move is interesting in that is represents a significant vote of confidence in both the incremental revenue that can be derived from OTT services and the potential to tap an entirely new customer base in the form of ‘dip-in’ Now TV users. While this goes hand in hand with an increased investment in original content and channels as well as sports rights to support the core service, it is clear that Sky sees the most upside in incremental revenue driven by OTT rather than strong additional growth in traditional satellite pay TV customers. With broadband and telephony being an increasingly important area of revenue growth, the connected device/OTT space becomes the next area for up-sell, meaning that the so-called ‘multi-product strategy’ becomes central. While none of the services require a tie-in to Sky’s own broadband, it is this very area that BT has chosen to attack with its bold move into sport. The free access to BT’s suite of new sports channels with a BT broadband 12 month contract means that not only could there be a subset of Sky TV customers who will migrate to BT broadband, but a further segment of existing BT customers who will not be available to Sky for triple-play up-sell. To date there has been no evidence that’s BT’s strategy is paying off (net TV additions for BT were roughly flat in the quarter to end June 2013). But BT says it believes this will change when the channels launch.
Sky’s strategy, then, is to fall back on its traditional strengths centred on content, but to do this in a way that embraces new forms of distribution and leverages the power of its existing customer relationships. Headroom for growth remains strong: despite triple-play penetration reaching 35 per cent among the Sky customer base, two-thirds of Sky customers have yet to take a broadband offer. With Sky out-performing the market in broadband net adds, this area is likely to ensure continued strong revenue and ARPU growth. But two areas of risk remain. If the majority of TV growth comes from Now TV, Sky will have to deal with an increasingly large segment of TV customers who are not tied into a contract and who are relatively low value in terms of ARPU. As this segment scales, clearly this could lead to large and seasonal fluctuations in churn and ARPU. The second area of risk is related: cannibalisation. While this is a risk that Sky is well aware of and keeping close tabs on, the renewed connected home push risks accelerating the transition to a more transient customer base.
UK TV viewing is about connection, says Ofcom report [[IHS] Screen Digest commentary, Aug 1, 2013]
The home entertainment experience is becoming increasingly connected with multi-tasking central to the enjoyment of TV content, according to the latest Communications Market Report from UK regulator Ofcom. According to the findings, there has been a huge increase in the devices that people take to the living room. On average, each UK household owns three different types on Internet-enabled device. The biggest growth over the last year in take-up of services and devices has been on the number of tablets and smart-phones. Thanks to the device mix, 22 per cent of people in the living room watching screens other than the main TV most of the time.
The main TV set remains important. Ninety-one per cent of UK population tune into the main TV set weekly up from 88 per cent in 2002, with viewers on average watching four hours a day in 2012 compared to 3.6 hours in 2006. Although the report finds that people gather around the TV in the living room, there has been a decline in the number of children with TVs in their bedroom; 52 per cent of UK children now have a TV set in their bedrooms which represents a 17 per cent decline over the last six years, mainly related to the increase number of tablets and Internet connected devices.
Average media household spend has increased in the last year to £113.51 a month after many years of decline. The biggest increase has been on mobile services (£46.73 a month) and fixed internet (£11.91 a month) and the biggest decrease has been on fixed voice (down £22.48 versus one year ago to £21.61 in 2012). TV spend has been stable over the last five years at between £28-£29 a month.
Our take
Ofcom figures reflect what IHS Screen Digest has long noted: live linear TV is not dead.
According to Ofcom, time-shifted viewing represents just 10 per cent of the total and hasn’t changed much over the last years despite the huge increase in DVR ownership. According to BARB figures DVR has grown from 18 per cent in 2007 to 55 per cent in 2010 and 67 per cent in 2012. Despite this, growth in time-shifted viewing has been only moderate up from six per cent four years ago.
More than half of UK adults are regular media multi taskers, they ‘stack’ or ‘mesh’while watching TV weekly, with tablet owners more likely to multi-task than average. Almost one in four UK adults made direct communication with friends and family about the programs as they watching (media meshing) and half of UK adults conduct other activities while they are watching TV on a weekly basis (media staking).
The increase in tablet owners has also changed consumer viewing behaviour with VOD requests coming from tablets increasing from three per cent in 2011 to 12 per cent in 2012. More than 56 per cent of tablet owners used them to watch TV and 57 per cent of those watched linear TV on the tablet.
Ofcom also found that, when it comes to the much-hyped area of social TV, it is news, reality shows and sport events that are engaging viewers through social media, but the knock-on effect is that consumers want to watch these shows live in order to engage socially, providing another boost for linear TV.
TV Everywhere Spreads Among US Television and Cable Networks; NBCUniversal Leads [IHS iSuppli press release, Oct 18, 2013]
NBCUniversal leads the US TV Everywhere (TVE) effort in providing access to TV content on second screens like smartphones and tablets, while EPIX and HBO share the distinction of supporting TVE on more second-screen devices than any other premium or basic cable network, according to a new report from the TV Intelligence Service at IHS Inc. (NYSE: IHS).
From Wikipedia: TV Everywhere (also sometimes known as authenticated streaming)[1] refers to a model wherein television providers and broadcasters, particularly cable channels, allow their subscribers to access their respective content on digital platforms, including video on demand and live streaming of the channels themselves. TV Everywhere systems utilize user accounts provided by the television provider—which are used to verify whether the user is a subscriber to a particular channel, thus allowing or denying access to the content. The U.S. provider Time Warner Cable first introduced the concept in 2009; in 2010, many television providers and broadcasters began to roll out TV Everywhere services for their subscribers, including major networks such as ESPN, HBO,NBC (particularly for its Olympics coverage).
NBCUniversal provides TVE in 15 of its 18 channels, or 83 percent of the studio’s total stable of cable and broadcast networks to pay-TV subscribers willing to authenticate on second-screen devices. Meanwhile, EPIX and HBO have been at the forefront of the TVE experience, with both very willing to embrace new technologies and offering significant amounts of content on their apps and portals.
EPIX first kicked off the TVE phenomena in October 2009, formed by partners Paramount, MGM and Lionsgate after their failed renewal with Showtime HBO followed suit in February 2010 with the launch of its web portal and how has a vast TVE library online, even though it does not yet offer live linear streaming.

HBO, along with Cinemax and BTN2Go, are the only three networks to have TV Everywhere authentication agreements with all major US pay TV operators.
For its part, Showtime is the only premium network offering live linear streaming through TV Everywhere. The company is also allowing for authentication outside of the home, a feature likely to expand to other basic and premium cable networks as TVE continues to evolve.
The last premium channel group to the party is Liberty’s STARZ. STARZ and Encore launched TV Everywhere services in October of 2012, but are still missing authentication deals with both Comcast and DISH Network.
One entity so far remains the lone hold-out among the major channel groups not providing any TV Everywhere content—Discovery Communications. But that will change as Discovery is expected to finally jump into the fray in the near to midterm time frame. It will likely become critical to offer similar services, IHS believes, as TVE access becomes more central to the future of US pay TV video.
Solving the cord-cutting problem before it gathers steam
All major pay-TV operators to date have implemented some form of the TVE service, although sometimes in very limited form, via either live linear streaming or video on demand (VoD). But while the streaming of live linear network feeds is largely relegated to in-home use, video on demand (VoD) is a significant out-of-home TVE product.
VoD streaming channels, at 73 including cable, premium and broadcast, far outnumber the channels offering live streaming, at 31, as shown in the attached figure. NBCUniversal, the TVE leader, has 15 VoD channels and five live streaming channels, followed by Time Warner with nine VoD channels and three live streaming channels.
“TV Everywhere has been developed as a collective strategy by both pay-TV operators and TV content owners to enhance the traditional linear TV proposition, so that secondary screens like tablets and smartphones can be used to view TV content in addition to the primary screen,” said Erik Brannon, analyst for U.S. cable networks at IHS. “And in spite of the differences in strategy, all TVE products have one thing in common: They allow for current pay-TV video subscribers to authenticate and consume on secondary screens a significant amount of content that they purchase as part of their normal pay-TV video subscriptions.”
TVE is one approach that pay-TV operators and network owners are using to stem the tide of cord-cutting among cable subscribers before the number of defections become significant. In many cases, cable subscribers are finding themselves increasingly tempted to end their subscriptions—either because of high costs or because of other alternatives now available, such as over-the-top (OTT) alternatives like Netflix. In the second quarter of 2013 alone IHS estimates that the pay-TV business shed 352,000 subscribers, mostly to seasonality, but some elements of cord-cutting are likely to have been present as well. To be sure, the combined price of $28 (Netflix, Hulu Plus and Aereo) may be more appealing to consumers than the $80+ average revenue per user that IHS estimates pay-TV video customers will pony up for service in 2013.
Through TVE, both pay-TV operators and network owners hope to add new functionality and interactivity to the television viewing experience. And by partnering with pay-TV operators, content owners like the broadcast networks hope they can continue to solidify their hold on the distribution of premium television content.
Device compatibility extending beyond iOS and Android
TV Everywhere is also evolving beyond Apple iOS and Android, the two platforms on which TVE apps first appeared. Now, TVE apps from networks are becoming available and are being deployed across a wide range of connected devices, including smart TVs; video game consoles like Microsoft’s Xbox; Amazon’s Kindle Fire; Blu-ray players; and digital media products such as Roku and Apple TV.
Adoption of TVE initiatives by the major channels is a reaction to the changing landscape of TV viewers in the country, Brannon noted. And as it continues to grow in awareness and popularity, TV Everywhere will remain a central focus for pay-TV operators.
6. Microsoft’s live TV solution on Xbox
From Worldwide launch of Xbox One sparks global celebration for a new generation in games and entertainment [Microsoft press release, Nov 21, 2013]
Xbox One’s innovative architecture means you no longer have to choose between your games and entertainment. Get multiplayer alerts while you watch TV, and keep watching TV while you play. Snap your NFL fantasy football stats next to the game. Jump instantly from a game to TV, movies, fitness, music, sports, the Internet and Skype video chat with the sound of your voice. With Xbox One, you never have to stop playing to talk to a friend, surf the Web or watch live TV. You also have access to a new generation of TV experiences, and starting in the U.S. and coming to many markets soon, OneGuide will allow you to access your favorite shows, channels, apps or games with the Bing natural language voice search.
Xbox One Live TV, Xbox Fitness with Yusuf Mehdi [scarlettgarden YouTube channel, Oct 27, 2013]
From Xbox One: Your Top Questions Answered [May, 2013]
Our goal is to enable live TV through Xbox One in every way that it is delivered throughout the world, whether that’s television service providers, over the air or over the Internet, or HDMI-in via a set top box (as is the case with many providers in the US). The delivery of TV is complex and we are working through the many technologies and policies around the world to make live TV available where Xbox One is available.
The TWC Case:
|
With an unexperienced person: Hands-on video: The Xbox One as a media device [gigaom YouTube channel, Nov 19, 2013]
First Wave of TV & Entertainment Apps Coming to Xbox One Unveiled [Xbox Wire from Microsoft, Nov 8, 2013]
Offering more entertainment options has always been important to Xbox fans. For years, we’ve been working with leading entertainment brands and TV providers to offer our customers a wide variety of live and on-demand entertainment. Today we unveiled the complete Xbox One experience – showcasing how Xbox One delivers the best games and multiplayer features, along with your favorite movies, music, sports and live TV experiences – all in one place.
“We set out to make Xbox One the all-in-one games and entertainment hub for your home. The one system that offers the best games next to the best entertainment experiences and apps,” said Marc Whitten, Xbox Chief Product Officer. “Along with offering a stellar app portfolio from around the world, Xbox One takes the next step by offering them in a way that is seamless and easy to use.”
In addition to delivering live TV in every market where Xbox One will be sold, we are also bringing premium, voice and gesture controlled TV and entertainment apps specifically designed for your living room. These apps have been built from the ground up uniquely for Xbox One and are designed to harness the power of the all-in-one platform. For example, Xbox One is empowering partners to bring media achievements and exclusive Snap experiences, as well as many other things to entertainment apps, offering everybody the opportunity to achieve badges or rewards for the media they consume in addition to gaming.
Something truly unique we’re doing with Xbox One is bringing together your favorite TV channels and entertainment app channels into one screen. Xbox One is also the only games and entertainment system that enables HDMI pass through. You can create your own personal Favorites in OneGuide – the Xbox One electronic program guide – so you can quickly and easily choose what you want to watch, whether it’s a TV channel like CBS, NBC or ESPN, or something inside an app like Xbox Video, Hulu Plus or the NFL on Xbox One. You can even add your personal photos and videos from the SkyDrive app to your OneGuide Favorites.
Additionally, a Bing search for TV, movies, games, or music scans across all apps to find exactly what you’re looking for, instead of having to hunt through each app individually. For the first time, you don’t have to juggle multiple screens across cable TV, video streaming services and other entertainment apps to quickly find the entertainment you’re looking for.
Today, we’re announcing the very first wave of some of the world’s biggest names in entertainment rolling out on Xbox One in the 13 launch markets between Nov. 22 at launch and spring 2014:
Australia
- Crackle
- Machinima
- MUZU TV
- Network Ten’s tenplay
- Quickflix
- SBS On Demand
- TED
- Twitch
Austria
- Eurosport
- Machinima
- MUZU TV
- TED
- Twitch
Brazil
- Crackle
- Machinima
- Muu
- Netflix
- Saraiva Player
- Sky Online
- SporTV
- TED
- Telecine
- Twitch
- Vivo Play
Canada
- CinemaNow
- Crackle
- Machinima
- MUZU TV
- Netflix
- Rogers Anyplace TV
- Sportsnet
- TED
- The NFL on Xbox One
- Twitch
France
- 6Play
- Canal+/CanalSat
- France 2,3,4,5
- La TV d’Orange
- Machinima
- MUZU TV
- MyTF1
- MYTF1VOD
- SFR TV
- TED
- Twitch
Germany
- Amazon\LOVEFiLM
- Eurosport
- Machinima
- MUZU TV
- TED
- Twitch
- Watchever
- Zattoo
Ireland
- Eurosport
- Machinima
- MUZU TV
- Netflix
- TED
- Twitch
Italy
- Eurosport
- Machinima
- MUZU TV
- Premium Play
- TED
- Twitch
Mexico
- Clarovideo
- Crackle
- Machinima
- Netflix
- TED
- Televisa
- The NFL on Xbox One
- TV Azteca
- Twitch
- Veo
New Zealand
- Machinima
- MUZU TV
- Quickflix
- TED
- Twitch
Spain
- Eurosport
- Gol Televisión
- Machinima
- MUZU TV
- RTVE
- TED
- Twitch
- Wuaki.tv
- Zattoo
United Kingdom
- 4oD
- Amazon\LOVEFiLM
- blinkbox
- Crackle
- Demand 5
- Eurosport
- Machinima
- MUZU TV
- Netflix
- NOW TV
- TED
- Twitch
- Wuaki.tv
United States
- Amazon Instant Video
- Crackle
- The CW
- ESPN
- FOX NOW
- FXNOW
- HBO GO (coming soon)
- Hulu Plus
- Machinima
- MUZU TV
- Netflix
- Redbox Instant by Verizon
- Target Ticket
- TED
- The NFL on Xbox One
- Twitch
- Univision Deportes
- Verizon FiOS TV
- VUDU

The list above* is just the first wave of third-party apps that are coming to Xbox One over the course of the next few months. We will continue to announce more apps coming to the platform and both the Xbox One and Xbox 360 entertainment app portfolios will continue to grow weekly.
*Xbox LIVE Gold membership required
In addition to the entertainment apps coming from partners, in every market Xbox One will also feature:
- Xbox Fitness
- Xbox Video
- Xbox Music
- Internet Explorer
- Skype
- SkyDrive
- Upload
With games, multiplayer gaming, live TV and the best entertainment apps, Xbox One is the most complete entertainment system.
Note that after AT&T Extends TV Watching to More Devices with Launch of U-verse TV on Xbox 360 [press release, Oct 11, 2010] and even after New U-verse Internet Customers Can Take Their Pick: A Free Xbox 360, SONOS PLAY:3, Kindle Fire or Nexus 7 Tablet [press release, March 18, 2013] that Xbox tie-up ended with AT&T U-verse TV To Drop Support For Xbox 360 on December 31 [Multichannel, Nov 26, 2013]:
“We’ve made this decision due to low customer demand,” an AT&T spokeswoman said via email on Tuesday. AT&T declined to say how many customers currently use the Xbox 360 as a set-top. … AT&T, the spokeswoman added, currently has no plans to support U-verse TV on the Xbox One. Verizon Communications FiOS TV is the first, and so far only, U.S. pay-TV provider to offer an authenticated app for the Xbox One during its initial launch phase.
With highly experienced users: Xbox One All-in-One Demo with Yusuf Mehdi and Marc Whitten [xbox YouTube channel, Nov 8, 2013]
From Xbox One: The Complete All-in-One Games and Entertainment System [Xbox Wire from Microsoft, Nov 8, 2013]
…
As we head toward Nov. 22, we’re showcasing the all-in-one capabilities of Xbox One. This is the real Xbox One in action. Corporate Vice President of Marketing and Strategy, Yusuf Mehdi, and Chief Product Officer Marc Whitten show the best of Xbox One in this new video. And, you can see 10 of our favorite new features below.
#1 – Unleashing the Power of Your Voice
A simple voice command turns on your Xbox One, your TV, your set-top box and your AV system because Kinect for Xbox One is an Infra-Red blaster. And when you say “Xbox On,” your game is always ready to resume from wherever you left off. You can start playing your favorite game, find your favorite show, change channels, turn up the TV volume and more – with the sound of your voice, powered by Bing voice recognition technology. Just say “Xbox, go to ESPN” and your TV will change directly to the ESPN channel. Or, “Xbox, go to Hulu Plus,” “Xbox, Volume Up,” “Xbox, Mute,” “Xbox, go to Music” – it’s simple. Kinect “talks to” your TV, set-top box and AV receiver, making it easier than ever to navigate entertainment in your living room.
#2 – Biometric Sign In
…#3 – Instant Resume and Instant Switching
We’ve talked about instant switching before, but now you can see it for yourself in action. The video showcases how quickly you can jump from one experience to another and right back where you left off. You can literally jump from a game to live TV, music, movies, sports, Web sites and back again in seconds, just by using your voice.
#4 – Watch Live TV via Xbox One
Xbox One lets you watch live TV from your HDMI-compatible cable or satellite box, making it easy to switch from games to live TV – all with the sound of your voice, and without having to switch TV inputs. No more multiple remotes, missed multiplayer matches while you’re watching TV, or frustrating delays. Just connect your set top box to your Xbox One and you can watch live TV through your Xbox One.
#5 – Get a Multiplayer Invite, while you are Watching a movie or live TV
…#6 – Game DVR and Upload Studio Let You Record and Share Your Greatest Moments
…#7 – Do Two Things at Once
You can also choose to snap two experiences together – so you can play a game while you watch TV or listen to Xbox Music. Or, watch the big NFL game while you manage your fantasy football team. For gamers, snapping Machinima opens up a whole new world of opportunity. Just by saying “Xbox, Snap Machinima,” the Machinima app will be snapped next to “Dead Rising 3” or your favorite game, and walk-throughs, game reviews, help videos and more will appear.
#8 – Skype on the Big Screen, With Groups and Free Long Distance
Skype is amazing on Xbox One, offering the only big screen experience with Group Video Chat with up to four people. Kinect is the only camera in the world that will follow the caller and pan and zoom automatically as if you had your own camera man. You can talk with your friends while surfing the Web or checking the latest stats of a sports team. And have full 1080p video calls for one-to-one chats on your TV. 1
1 For 1080p video call, both users must have compatible HD displays, web cams, messaging clients, and broadband internet.
#9 – OneGuide Delivers Personalized Guide to TV, Apps and More
Xbox One has its own TV listings guide that can be navigated with your voice. Say “Xbox, what’s on Discovery Channel?” and boom, there you have the list of shows. Call out your favorite TV show by name and start watching it instantly. And, Xbox One is the only system that brings together your favorite TV channels and entertainment app channels into one screen. Create your own personal Favorites in OneGuide, so you can easily choose what you want to watch – whether it’s on Fox, CBS, NBC, ESPN, Hulu Plus or the NFL on Xbox One app. For the first time you don’t have to juggle multiple screens across cable TV, video streaming services and other entertainment apps to quickly find the entertainment you’re looking for.
#10 – Xbox SmartGlass Enhances Gaming in New Way
…
Microsoft Is Changing the Game for Sports Fans [Xbox Wire from Microsoft, Sept 3, 2013]
Whether it’s in the living room or on the playing field, Microsoft and products like Xbox, Surface, and Windows 8 are impacting the way we experience our favorite sports.
In May, Microsoft announced a multi-year, landmark partnership with the NFL. For the Xbox community, this means exclusive interactive NFL experiences for fans at home, found only on Xbox One starting this November. Today, we’re excited to share more details about this partnership and the game changing NFL experiences for Xbox One and Surface. We are also pleased to introduce NFL.com Fantasy Football on Xbox 360, Windows 8 and Windows Phone which are available for download today.
Also making headlines today is the confirmation and details around the all-new ESPN application for Xbox One. Leveraging the unique platform capabilities of Xbox One, sports fans will now have control of the live programming, highlights, stats and more across ESPN like never before.
The NFL on Xbox One and Surface
Tailored for you, the NFL on Xbox One will deliver the best of the NFL, in a way that will completely reimagine the way you experience football from the comfort of your home. Only Xbox One can bring interactivity to live games, stats, scores, highlights and your NFL.com Fantasy Football team all together on the best screen in the house – your TV. Xbox One will personalize your NFL experience, for your team, with the best content the NFL has to offer including NFL.com, NFL Network, and NFL RedZone. Whether you’re watching the game or not, Xbox One makes it easy to keep tabs on the league with Snap mode. You can watch live TV, play games, or watch movies, while simultaneously tracking your NFL.com Fantasy Football team, or checking in for the latest scores and stats.
While you’re watching at home, Surface technology is in the stadium, on the sidelines to help protect your favorite players. Teams and trainers will implement use of the X2 concussion testing application this season to quickly diagnose potential player concussions immediately after leaving the playing field with the help of Surface tablets, helping quickly determine if they can get back in the game or call it a day.
ESPN on Xbox One We are also excited to announce ESPN on Xbox One, which builds on our innovations with ESPN on Xbox 360, and provides you with the best of ESPN networks and web content personalized just for you. Featuring deeper sports content personalization, ESPN on Xbox One gives you immediate access to the teams and sports you care about most. With WatchESPN, ESPN.com, and ESPN3 video content, you get the best highlights, live events and on-demand sports in full screen mode. Additionally, you will receive personalized scores and stats in Snap mode from the most popular sports.
NFL.com Fantasy Football on Xbox 360, Windows 8, and Windows Phone
Beginning today, NFL.com Fantasy Football is now available on Xbox 360, offering a whole new way to track your team and leagues on the best screen in your house – your TV. This destination is tailored just for you and your NFL.com Fantasy Football team, and is easy to jump into and simple to use. The Xbox 360 app brings you an endless playlist of Fantasy Football highlights, Fantasy analysis, stats, scores and standings about your NFL.com Fantasy Football team and leagues, making sure you don’t miss a thing. Consumers can head to NFL.com today to sign up for a league and get in the game before kick off on September 5th.
And, with the new NFL.com Fantasy Football apps for Windows 8 and Windows Phone, you can keep tabs on your team and leagues on your tablet, PC, and mobile device as well.
Download NFL.com Fantasy Football for Xbox 360, Windows 8 and Windows Phone today, and stay tuned for game changing experiences on Xbox One this November.
7. Preliminary information on the upcoming products from Xbox Entertainment Studios
Best Advice: Nancy Tellem [Fortune Magazine YouTube channel, Oct 31, 2013]
Faces to Watch in 2014: Digital media | Nancy Tellem, Mike Hopkins, Issa Rae [Los Angeles Times, Dec 27, 2013]
A big year is coming up for game designers Ryan and Amy Green and Ruben Farrus, plus Microsoft’s Nancy Tellem, Hulu’s Mike Hopkins and Web writer-actress Issa Rae.
The Times asked its reporters and critics to highlight figures in entertainment and the arts who will be making news in 2014. Here’s who they picked:
Nancy Tellem | Microsoft’s president of entertainment and digital media
The veteran CBS television executive had her work cut out when she joined Microsoft Corp. in 2012 to launch a Santa Monica studio to create original content.
Long fascinated with changes in consumer behavior, Tellem is now playing an important role in determining what appeals to younger consumers accustomed to getting their entertainment on multiple screens. She is trying to build on the momentum that Microsoft has achieved by encouraging millions of consumers to consider the Xbox more than just a video game console. Xbox users spend more than half of their time online listening to music and streaming movies, TV shows and exploring other entertainment options. Microsoft wants to build a trove of exclusive content to differentiate its game system from the rival Sony PlayStation.
Microsoft’s slate of new shows designed to appeal to the digitally connected generation is expected to launch in the first half of 2014. Microsoft also brought Tellem on board to make inroads with Hollywood’s creative community. One of the first projects she announced was a live-action TV series, produced by Steven Spielberg, based on the “Halo” game franchise for Xbox Live, a feature that enables gamers to play against online opponents.
Tellem was trained as a lawyer and worked her way up the ranks in business affairs at Lorimar, Warner Bros. and then CBS. At the broadcast network, Tellem was a key executive in the development of new shows, including the hit reality show “Survivor.” She was one of the TV industry’s first female entertainment presidents.
— Meg James
Mike Hopkins | Hulu chief executive
…Issa Rae | Actress-writer-director
…
Nancy Tellem at Wrap Power Women Breakfast: Microsoft Is Aiming for a “Game of Thrones” [The Wrap YouTube channel, Oct 30, 2013]
Nancy Tellem at Wrap Power Women Breakfast: Microsoft Is Aiming for a ‘Game of Thrones’ (Video) [TheWrap, Oct 30, 2013]
Nancy Tellem, Microsoft’s new president of entertainment and digital media, said on Wednesday she has the means and the ambition to make a “Game of Thrones”-like series for the new studio backed by the technology giant.
“I have the ambition” to make a show as grand as “Game of Thrones,” said the former president of CBS entertainment at TheWrap‘s Power Women Breakfast at the Montage in Beverly Hills.
“That, to me, was greatest testament to how wonderful television can be and how engrossed people are and committed – and it was a social experience,” she said.
And, she said smiling, Microsoft’s budget was “enough for me to do my job, let’s just say.”
…
Not being bound by the constraints of a 22-episode season or even show length and with the technology to engage the viewer through the Xbox platform allows Tellem and her team to “focus on the content itself” and then way viewers can “share that experience.”
Tellem said she expects that Microsoft will begin rolling out its new shows — which will range from sports programs to scripted series — as soon as the spring. She says they have not decided whether to release the episodes over time or put them all out at once, like Netflix.
Asked about binge viewing, Tellem said she was not sure if Microsoft would release all its content at once, observing that interactivity was more the distinctive purview of Microsoft.
Xbox One Reveal: Halo TV and NFL [xbox YouTube channel, May 23, 2013]
From Microsoft unveils Xbox One: the ultimate all-in-one home entertainment system [press release, May 21, 2013]
Blockbuster titles, Steven Spielberg-produced Halo TV series, and exclusive agreements with the NFL transform games, TV and entertainment for the 21st century living room.
…“Halo” television series. Award-winning filmmaker, director and producer, Steven Spielberg will executive-produce an original “Halo” live-action television series with exclusive interactive Xbox One content, created in partnership with 343 Industries and Xbox Entertainment Studios.
RTS Cambridge Convention 2013: Xbox One – From Gaming to Content [Royal Television Society, Sept 12, 2013]
Created for gaming, the Xbox One is the latest challenger to old-fashioned telly, but, said Microsoft entertainment and digital media president Nancy Tellem, it is not the final nail in the TV industry’s coffin.
“It’s an augmentation,” she argued. “Right now, [TV] is in a renaissance period — what Xbox offers is a different TV experience.”
Since joining Microsoft from CBS a year ago, Tellem has been spearheading the software giant’s move into TV, delivered via its Xbox One gaming console.
Interactivity among its current 76 million connected console users would be the key to Xbox One’s success. “It isn’t just delivering content. It really offers an immersive experience,” she said.
The session was chaired by Matt Frei from Channel 4 News, who said that he enjoyed being a “passive” consumer of TV. To laughter from the audience, Tellem replied: “Xbox addresses the next generation.”
Tellem identified sport, live events and scripted entertainment as genres particularly suited to Xbox One. Mentioning Game of Thrones as the type of complex drama suited to the console, she claimed: “You can give a much richer understanding of the characters and their history.”
Tellem is in discussions with studios and talent about commissions, which she hopes to announce in a few weeks. Earlier this year, Microsoft revealed that a TV show based on the Halo game, with the involvement of Steven Spielberg, was in the pipeline.
She also countered a suggestion from the audience that Xbox One’s programming would be geared at 18-year-old boys. Tellum said that her ambition was to reach out beyond traditional gamers, adding that 40% of its platform users were female, with most of the audience between 18 and 40.
“My mission it to transform it into an entertainment service,” she said, which would include music, film and sport as well as games. “It’s a simple offering that can access all your entertainment needs.”
Before joining Microsoft, Tellem had worked at the US network CBS for a decade and a half, latterly as senior adviser to chief executive Leslie Moonves.
Xbox Entertainment Studios to Debut Documentary Series Exclusively on Xbox in 2014 [Xbox Wire from Microsoft, Dec 19, 2013]
First Documentary Explores the Fabled Atari Mystery
Today, Xbox Entertainment Studios announced an original documentary series that will debut exclusively on Xbox in 2014. Xbox will produce the series with two-time Academy Award-winning producer Simon Chinn (Searching for Sugar Man and Man on Wire) and Emmy-winning producer Jonathan Chinn (FX’s 30 Days and PBS’s American High) through their new multi-platform media company, Lightbox.“Our collaboration with Xbox offers an unparalleled opportunity to make a unique series of films around the extraordinary events and characters that have given rise to the digital age,” said Simon Chinn. “Our goal is to produce a series of compelling and entertaining docs which will deploy all the narrative techniques of Simon’s and my previous work. It’s particularly exciting to be partnering with filmmakers like Zak Penn who come to this process from other filmmaking disciplines and who will bring their own distinctive creative vision to this,” added Jonathan Chinn.
“Jonathan and Simon Chinn are the perfect team to spearhead this series for Xbox. They are consummate story tellers and they plan to match their creative sensibility with the best talent in the industry,” commented Xbox Entertainment Studios President Nancy Tellem. “These stories will expose how the digital revolution created a global democracy of information, entertainment and commerce, and how it impacts our lives every day.”
The first film in the groundbreaking series investigates the events surrounding the great video game burial of 1983. The Atari Corporation, faced with overwhelmingly negative response to the video game “E.T. the Extra-Terrestrial,” buried millions of unsold game cartridges in the middle of the night in the small town of Alamogordo, New Mexico.
Fuel Entertainment, an innovator in cross-platform content development, secured the exclusive rights to excavate the Atari landfill and approached Xbox. Lightbox will document the dig, which is planned for early next year.
Filmmaker and avid gamer Zak Penn (X-Men 2, Avengers, Incident at Loch Ness) will direct. This episode will not only document the excavation, it will also place the urban legend of the burial in the context of the precipitous rise and fall of Atari itself.
“When Simon and Jonathan Chinn approached me about this story, I knew it would be something important and fascinating,” said Penn. “I wasn’t expecting to be handed the opportunity to uncover one of the most controversial mysteries of gaming lore.”
Shooting begins in January. The series will air exclusively on Xbox One and Xbox 360 in 2014 and will be available globally in all markets where Xbox Live is supported.
8. Xbox Music and Xbox Video services for other devices
Xbox Music + Video apps for Windows Phone 8 [Windows Phone Central YouTube channel, Dec 18, 2013]
Xbox Video for Windows Phone 8 Walkthrough [Pocketnow YouTube channel, Dec 19, 2013]
New Xbox Video and Xbox Music apps Available for Windows Phone 8 Customers [Xbox Wire from Microsoft, Dec 18, 2013]
It’s a big day for Windows Phone 8 customers. New apps for Xbox Video and Xbox Music are becoming available today in the Windows Phone store.
Xbox Video Comes to Windows Phone
Today, Xbox Video launches on Windows Phone 8, so now you can truly take your movies and TV shows with you wherever you go. Stream from the cloud or download your favorite movie or TV episodes to your phone to watch them offline. You can rent or buy the newest hit movies or search for classics from the massive catalog with the only app that lets you download movies and TV episodes right to your Windows Phone 8. You’ll even get Rotten Tomatoes ratings and Metacritic scores right on your phone.
Xbox Video on Windows Phone 8 also delivers countless TV shows. With a Season Pass, brand new episodes are automatically added to your collection so you don’t miss a beat from your favorite new shows. Or catch up with every episode from past seasons and relive the glory days of your favorite shows from years past.
With Xbox Video, your collection follows you from screen to screen in the cloud. For example, you can buy and start a movie or TV show from XboxVideo.com or Xbox Video on a Windows 8.1 tablet, and continue watching on your Xbox One, Xbox 360 or Windows Phone 8. And with Xbox SmartGlass, you get a richer viewing experience that isn’t found anywhere else. Xbox SmartGlass integrated with Xbox Video for Xbox One and Xbox 360 offers second-screen experiences with bonus content and exclusive extras, serves as a remote control, and gives you new ways to interact with whatever you’re watching.
Xbox Video is a free download in the Windows Phone Store today, and don’t forget to check out our new Web store at XboxVideo.com.
A Peek at the New Xbox Music for Windows Phone
Also releasing today is a new Xbox Music preview app. This early-access app gives Xbox Music Pass users a look into the new music experience on Windows Phone 8.¹ Stream millions of songs from your phone or download the ones you want for offline listening. Create playlists that sync across your devices. Play songs from your personal music collection alongside your Xbox Music Pass content. It’s the best way to experience all the music you love on your Windows Phone.
The Xbox Music Preview is available in all 22 markets where Xbox Music is available today and can be found in the Windows Phone Store. The full release will roll out in 2014. Xbox Music is available today on Windows Phone, Xbox One, Xbox 360, Windows 8/8.1, online at Music.Xbox.com and iOS and Android devices.
¹ Xbox Music Pass required to use the app. Compatible devices and internet required. Data charges apply. See Xbox.com/music.
Xbox Music For Android Review [Mikey Capoccia YouTube channel, Sept 9, 2013]
Microsoft launches Xbox Music across iOS and Android, adds free streaming on the Web [press release, Sept 8, 2013]
Enjoy your favorite music from a 30 million-song global catalog powered by the one service that integrates your music experiences across your tablet, PC, phone and TV. All the music you love, every way you want it.
Nearing its one-year anniversary, Microsoft Corp.’s all-in-one music service, Xbox Music, continues making strides to deliver all the music people want, wherever they want it played. Today, Microsoft announced its plans to bring Xbox Music to iOS and Android devices, as well as free streaming on Xbox Music via the Web.[1]
Accessing music across all the different devices people interact with has become complicated. People today use PCs, laptops, tablets, phones and TVs to access different music services that don’t connect with one another. Xbox Music is designed to solve this common problem by combining the best of all music offerings with free streaming on the Web and on Windows 8 PCs and tablets, Internet radio, subscription (called Xbox Music Pass), and download-to-own options.[2] With today’s news, access to Xbox Music grows to include iOS and Android devices, as well as a free Web-based interface on computers.
“Xbox Music now, more than ever, powers music experiences between Windows 8, Xbox, Windows Phone, and now iOS, Android and the Web,” said Jerry Johnson, general manager of Xbox Music. “We’re also excited to connect artists with their fans on the most anticipated consumer product of the year when Xbox One launches Nov. 22.”
Expanding the Xbox Music family of devices
Starting today, your Xbox Music Pass brings the catalog of music to iOS and Android devices. Get unlimited access to the songs and artists you want at any time with playback across your tablet, PC, phone and Xbox console for $9.99 per month or $99.99 per year. Add a song to your collection on your Xbox, and you’ll also have that song on your iOS, Android or Windows 8 device on the go or at the office. Xbox Music Pass also unlocks unlimited access to tens of thousands of music videos on your Xbox 360.
With the addition of free streaming on the Web, enjoy on-demand access to 30 million songs globally for free on the Xbox Music Web player at http://music.xbox.com or through the Xbox Music app on all Windows 8 tablets and PCs. Discovering and enjoying free music is as easy as typing an artist or song name and hitting “play.” Songs are instantly available to stream at no cost and for you to create an unlimited amount of playlists.[1]
Continued innovation
Xbox Music will continue to grow and evolve over the coming months. Microsoft will add Radio to the free Web player, a quick and dynamic way to personalize your collection, discover new favorites, and create ultimate playlists by launching instant mixes based on your favorite artists. With unlimited skips and a view of the full recommended music stream, Radio puts you in control of your Internet radio experience.[1]
Xbox Music will grow on Windows 8 when it adds the anticipated new Web Playlist tool this fall. The tool scans all the artists and music available on a given Web page and creates a custom playlist of all that music. Think about the Web page of your favorite radio station, or an upcoming music festival, and all the bands and songs included on that Web page. Web Playlist identifies all that music and creates an instant, custom playlist inside Xbox Music with the simple touch of a button. Web Playlist along with Windows 8.1 will be released Oct. 17.
In the coming months, additional updates for iOS and Android platforms will become available, including an offline mode that lets you save your music to your device for playback without an Internet or data connection.
About Xbox
Xbox is Microsoft’s premier entertainment brand for the TV, phone, PC and tablet. In living rooms or on the go, Xbox is home to the best and broadest games, as well as one of the world’s largest libraries of movies, TV, music and sports. Your favorite games, TV and entertainment come to life in new ways through the power of Kinect, Xbox SmartGlass and Xbox Live, the world’s premier social entertainment network. More information about Xbox can be found online at http://www.xbox.com.
[1] Free streaming available only on the Web and devices running Windows 8 or later. Limited hours of free streaming after six months; unlimited with paid subscription. Coming later this fall: artist-based Radio on Android, iOS and the Web.
[2] Xbox Music Pass is streaming only on Xbox consoles, Android, iOS and the Web. Applicable taxes extra. On Xbox consoles, Xbox Music requires an Xbox Music Pass and an Xbox Live Gold membership (both sold separately). Download music on up to four devices. Some Xbox Music content may not be available via Xbox Music Pass, and may vary over time and by region. Coming later this fall: Xbox music download-to-own on Android and iOS, and playlists and song sync on Windows Phone 8. See http://www.xbox.com/music.
For details, please visit http://news.xbox.com.
For assets, please visit http://news.xbox.com/media.
Device businesses should have a China-based independent headquarter at least for Asia/Pacific if they want to succeed
Back in August I found that China is the epicenter of the mobile Internet world, so of the next-gen HTML5 web [Aug 5, 2013]. That statement was strengthened even more recently with MediaTek MT6592-based True Octa-core superphones are on the market to beat Qualcomm Snapdragon 800-based ones UPDATE: from $147+ in Q1 and $132+ in Q2 [Dec 22, 2013; Jan 27, 2014].
Latest Nokia vs Apple vs Android:
With a trend analysis of the importance of the Asia/Pacific market in general, and the Chinese market in particular one comes to an even more striking conclusion: except Samsung (as it is just nearby) all dominant players in the mobile device market of today, and especially tomorrow, have to operate from China based headquarters. Otherwise they are unable to take the relevant decisions (unlike what was possible for PC era, just from U.S. based headquarters). This is especially applied to the merged Nokia-Microsoft Device Business!

Sources:
– Analysys International: China Mobile Phone Sales Hit 100 Million in Q3, 2013 [Nov 8, 2013]
– Gartner sources: like the latest Gartner Says Smartphone Sales Accounted for 55 Percent of Overall Mobile Phone Sales in Third Quarter of 2013 [Nov 14, 2013]
– IDC Finds Worldwide Smartphone Shipments on Pace to Grow Nearly 40% in 2013 While Average Selling Prices Decline More Than 12% [Nov 26, 2013]
– For IDC look at Smartphones Expected to Grow 32.7% in 2013 Fueled By Declining Prices and Strong Emerging Market Demand, According to IDC [June 4, 2013] as well (for Worldwide Smartphone Shipments by Market Maturity i.e. emerging and developed). Here is the historical chart embedded there:
 Developed Markets include: USA, Canada, Western Europe, Japan, Australia, and New Zealand.

With the latest news release of Jan 27 (Android ends the year on top but Apple scores in key markets) from Kantar Worldpanel Comtech one can compile an almost 2 years long representation of the smartphone trends in the key markets via a set of following charts:

The latest comments on that (from the news release) by Kantar Worldpanel Comtech:
Android ended 2013 as the top OS across Europe with 68.6% share, while Apple held second place with 18.5%. Windows Phone continues to show high year-on-year growth, but its share of the European market has essentially remained flat at 10.3% for the past three months.
Android finished 2013 strongly, showing year-on-year share growth across 12 major global markets including Europe, USA, Latin America, China and Japan. Apple has lost share in most countries compared with this time last year, but importantly it has held strong shares in key markets including 43.9% in USA, 29.9% in Great Britain and 19.0% in China.
Windows Phone has now held double digit share across Europe for three consecutive months. Unfortunately for Nokia the European smartphone market is only growing at 3% year on year so success in this market has not been enough to turn around its fortunes – reflected in its recent disappointing results. Its performance also deteriorated toward the end of 2013 in the important growth markets of China, USA and Latin America.
It’s no surprise that everyone is concentrating on high growth China, but currently local brands are proving clear winners. In December, Xiaomi overtook both Apple and Samsung to become the top selling smartphone in China – a truly remarkable achievement for a brand which was only started in 2010 and sells its device almost exclusively online. The combination of high spec devices, low prices and an ability to create unprecedented buzz through online and social platforms has proved an irresistible proposition for the Chinese.
Additional information for the period was provided by earlier Kantar Worldpanel Comtech news releases:
Android leads OS U.S. sales, as LG and Nokia see resurgence [Jan 7, 2014]
In the 3 months ending November 2013, Android maintained its lead of smartphone sales on the U.S., capturing 50.3% of the smartphone market. iOS follows with 43.1% of smartphone sales, an increase month on month, however, down 9.9% versus the same period a year ago, according to data on the U.S. market released today by Kantar Worldpanel ComTech.
Windows Phone, the third largest OS in the U.S, sold nearly 5% of smartphones in the 3 months ending November 2013, up 2.1% points from the previous year.
As with the previous period, Verizon maintained its lead as the top smartphone carrier, with just under a third of sales (31.7%). AT&T, in second, had 28.3% of smartphone sales in the 3 months ending November 2013. T-Mobile, overtaking Sprint as the third largest carrier had 13.3% of sales, and was the only major carrier to see growth year on year (up 6.3%).
The data is derived from Kantar Worldpanel ComTech USA’s consumer panel, which is the largest continuous consumer research mobile phone panel of its kind in the world, conducting more than 240,000 interviews per year in the U.S. alone. ComTech tracks mobile phone behavior and the customer journey, including purchasing of phones, mobile phone bills/airtime, and source of purchase and phone usage. This data is exclusively focused on the sales within this 3 month period rather than market share figures. Sales shares exemplify more forward focused trends and should represent the market share for these brands in future.
Kantar Worldpanel ComTech Global Strategic Insight Director, Dominic Sunnebo states, “The iPhone 5S and 5C were the two bestselling smartphones in the U.S for the 3 months ending November 2013. However, increased rivalry from Android brands and a resurgence of LG and Nokia, has made year-on-year share gains for Apple difficult. This is especially true on T-Mobile.”
On T-Mobile, the ‘UNcarrier’ strategy, launched earlier in 2013, has been successful because it has attracted first-time smartphone buyers, looking to upgrade to their first smartphone. Among T-Mobile smartphone buyers in November 2013, 55% of those that purchased an LG and Nokia smartphone were first-time smartphone buyers, compared to just 39% of Apple customers.
Sunnebo continues, “First-time smartphone buyers remain a key demographic for carriers and brand alike. The lower end iPhone 5C represents an opportunity for Apple to attract these customers. Thus far the majority of 5C customers have come from other smartphone platforms, though if historical trends hold, the lower end model (historically the older iPhone model following the release of a new iPhone), should be able to attract this demographic with its lower price and comparable specs.”
Apple launch momentum continues [Jan 7, 2014]
The latest smartphone sales data from Kantar Worldpanel ComTech, for the three months to November 2013, shows Apple’s share of smartphone sales continuing to grow month on month following the release of the iPhone 5S and 5C models. However, its share of most major markets remains lower than the same time last year as it increasingly faces challenges from its rivals.
While there’s no doubt that sales of the iPhone 5S and 5C have been strong, resurgent performances from LG, Sony and Nokia have made making year on year share gains increasingly challenging for Apple. Windows Phone, for example, is now the third largest OS across Europe with 10.0% – more than double its share compared with last year.
Apple now accounts for 69.1% of the Japanese market, 43.1% in the United States, 35.0% in Australia and 30.6% in Great Britain.
Strong sales of the iPhone 5S and 5C can be linked to high levels of customer satisfaction with both models, despite fears that the lower-end 5C could damage Apple’s appeal.
Some people worried that Apple was risking its historically high consumer satisfaction levels by releasing a lower cost, plastic iPhone. However, the latest data for the US shows that the iPhone 5C has an average owner recommendation score of 9.0/10 versus 9.1/10 for the iPhone 5S. Both devices attract different customers but crucially each group of owners remains very happy with their choice and are recommending it to others.
Android gains 3% market share each quarter in China [Nov 28, 2013]
Kantar Worldpanel ComTech is the first continuous panel to gather representative mobile phone data in China. The panel has been created to provide insight including mobile phone ownership, sales, usage, churn, loyalty and pricing in Chinese telecoms market.
The key points of Q3 report:
- Android’s steady growth in China is mainly coming from cheaper local brands, consumers are seeking for the ultimate value for money device.
- There were many speculations about the iPhone 5s and 5c prior their official launch. It actually made negative impact to iPhone Q3 sales, as people were holding out for the new models, and reduced Apple’s sales by almost 50% compared to the previous quarter.
- Almost a quarter of smartphone sales were made via online channels in 2013Q3. Even though online channels usually offer better price, the ability to test the phone is also a key purchase decision factor for Chinese customers, making it important for manufactures and leading retail chains to develop effective O2O strategies
- As most Android devices offer similar user experience, consumers are more focusing on cost effective devices.
¥ 1000 – ¥ 2000: US$ 165 – US$ 331
¥ 2000 – ¥ 3000: US$ 331 – US$ 496
¥ 3000- ¥ 4000: US$ 496 – US$ 661

|
With Kantar Worldpanel Comtech vendor market shares be very careful as the latest Analysys International: Apple’s Share Declining in China Smartphone Market in Q3, 2013 is providing quite a different picture: The statistics from EnfoDesk, the Survey of China Mobile Terminals Market in Q3, 2013, newly released by Analysys International, shows that the sales of China mobile phone (excluding parallel imports and the cottage) hit 102.66 million, up 54.5 percent year on year with a sequential growth rate being 13.6 percent by 2013Q3. Samsung, Lenovo and Coolpad still ranked top three with market share being 18.1 percent, 11.4 percent and 9.0 percent. |


Nokia and Windows global momentum continues [Nov 4, 2013]
The latest smartphone sales data from Kantar Worldpanel ComTech, for the three months to September 2013, shows Windows Phone now makes up one in 10 smartphone sales across the five major European markets*, has overtaken iOS in Italy, and is gaining momentum in emerging markets. Android remains the dominant operating system across Europe with 71.9%, an increase of 4.2 percentage points compared with the same period last year.
Windows Phone, driven almost entirely by Nokia sales, continues to make rapid progress in Europe and has also shown signs of growth in emerging markets such as Latin America.
With the smartphone market in developed countries so congested, it is emerging economies that now present manufacturers with the best opportunity for growth.
Nokia dominated in Latin America for many years, and while its popularity declined with the fortunes of Symbian it now has an opportunity to regain the top-spot. The majority of consumers in Latin America still own a Nokia featurephone and upgrading to an entry level Lumia is a logical next step. Price is the main barrier in developing markets and the budget Lumia 520 opens the door to smartphone ownership for many.
…Local brands growing in China
China is increasingly dominated by Android which accounts for 81.1% of the market, up 14.6 percentage points from last year. Domestic manufacturers made up 44% of smartphone sales in the latest period, compared to just 30% the previous year. Huawei, Xiaomi, Lenovo and Coolpad handsets are particularly popular outside of China’s largest cities and represent a more value-for-money option than global brands.
Chinese consumers are prepared to make a huge investment in their smartphone, with some spending up to 70% of their monthly salary on a new device. With such a high investment, Chinese consumers want to get the best value for money and are increasingly opting for a high-spec local brand over a low-spec global equivalent. The message for global manufacturers is clear – Chinese consumers demand value, and overpriced entry-levels models no longer cut it against increasingly impressive local competition.
Kantar Worldpanel ComTech: Urban China Smartphone Sales Data to Q313

Windows Phone nears double digit share across Europe [Sept 30, 2013]
The latest smartphone sales data from Kantar Worldpanel ComTech, for the three months to August 2013, shows Windows Phone has posted its highest ever sales share of 9.2% across the five major European markets* and is now within one percentage point of iOS in Germany. Android remains the top operating system across Europe with a 70.1% market share, but its dominant position is increasingly threatened as growth trails behind both Windows and iOS.
Windows Phone has hit double digit sales share figures in France and Great Britain with 10.8% and 12% respectively – the first time it has recorded double digits in two major markets.
After years of increasing market share, Android has now reached a point where significant growth in developed markets is becoming harder to find. Android’s growth has been spearheaded by Samsung, but the manufacturer is now seeing its share of sales across the major European economies dip year on year as a sustained comeback from Sony, Nokia and LG begins to broaden the competitive landscape.
Windows Phone’s latest wave of growth is being driven by Nokia’s expansion into the low and mid range market with the Lumia 520 and 620 handsets. These models are hitting the sweet spot with 16 to 24 year-olds and 35 to 49 year-olds, two key groups that look for a balance of price and functionality in their smartphone.

A key milestone for Android in China [May 31, 2013]
Kantar Worldpanel ComTech, the global market leader in longitudinal Telecom research panels, reports at the end of Q1 2013, Urban China Smartphone penetration reached 42%, an increase of 1.2% compared to Q4 2012. According to Kantar Worldpanel ComTech’s latest research in China, most of Smartphone growth comes from new Smartphone adopters, with almost half of Featurephone owners who changed their device in last quarter upgrading to a Smartphone. Craig Yu, Consumer Insight Director at Kantar Worldpanel ComTech, comments:”Featurephones are losing their price advantage as Android Smartphones are rapidly becoming more affordable and delivering better value. We expect to see accelerated Smartphone adoption in China in the coming months.”

During the first quarter of 2013, Android continued its steady growth in China, marking a key milestone in reaching 50% share of Smartphone Installed Base. At the end of March 2013, Android widened its lead of Smartphone operating systems with a 51.4% market share, an increase of 2.8% compared to the previous quarter. Second and third place was taken by Symbian and iOS, whose market share is 23% and 19.9% respectively. Symbian has declined 2% in the last quarter, whilst iOS remained resilient. Following the same trend, Symbian looks likely to lose its second place to be the third in the next 2 quarters.
Kantar Worldpanel ComTech also tracks the performance of various mobile device brands, according to its latest report, many Chinese local brands have been working closely with carriers and demonstrated strong growth in the Smartphone market for the first three months of 2013. ZTE, Lenovo and Xiaomi all have experienced share increases.

The combined market share of above four local brands are at 20%, a 17.6% growth in the past 6 months. Huawei, ZTE, Lenovo, Coolpad & Xiaomi combined make up 1 in 5 of all Smartphones in active use in China-this proportion will continue to grow as Nokia’s existing dominance is challenged.
Yu continues:”Local manufacturer brands have been able to drive strong growth through bundling their handsets with carriers tariff offers, seeking out new sales channels & combining innovative product design with value to capture many first time Smartphone buyers and those residing in City tiers 2/3/4.
However, Samsung remains the fastest growing Smartphone brand in China, ended Q1 2013 with 15.2% share of Installed Base (1.5%pts). Craig Yu continues:”Samsung has recently launched the Galaxy S4, selling over 10 million units globally in less than one month-we predict the launch of Galaxy S4 mini in the not too distant future will greatly increase its product reach in urban China.”


Apple achieves its highest ever Smartphone share in US [Dec 12, 2012]
The latest smartphone sales data from Kantar Worldpanel ComTech shows Apple has achieved its highest ever share in the US (53.3%) in the latest 12 weeks*, with the iPhone 5 helping to boost sales. In Europe, however, Android retains the highest share with 61% of the market, up from 51.8% a year ago.
* 12 w/e 25th November 2012
Apple has reached a major milestone in the US by passing the 50% share mark for the first time, with further gains expected to be made during December.
Meanwhile in Europe, Samsung continues to hold the number one smartphone manufacturer spot across the big five countries, with 44.3% share in the latest 12 weeks. Apple takes second place with 25.3% share while HTC, Sony and Nokia shares remain close in the chase for third position.
Although Windows sales in the US remain subdued, Nokia is managing to claw back some of its share in Great Britain through keenly priced Lumia 800 and 610 prepay deals. The next period will prove crucial in revealing initial consumer reactions to the Nokia 920 and HTC Windows 8X devices.
Nokia continues to find it tough to attract younger consumers in Great Britain. Over the past six months, just 28% of Nokia Lumia 800 sales have come from under 35’s, compared with 42% of all smartphone sales. With the Nokia Lumia 920 being one of the few handsets available on EE 4G, new tariffs may help to change this by attracting early adopters in the coming months.
Smartphone percentage penetration in Great Britain hit 60% in the latest period, with 83% of all mobile phone sales over the past 12 weeks being smartphones.
iPhone 5 release slows Android gains [Oct 30, 2012]
Recent smartphone sales data from Kantar Worldpanel ComTech shows Android continuing to gain share across Europe in latest 12 weeks of sales* increasing its share to 67.1% share, up from 50.9% a year ago. However, its rate of growth has slowed as week one of iPhone 5 sales show iOS gaining in the US and Great Britain.
My insert (see Q4’12):

* 12 w/e 30th September 2012
(Apple iPhone 5 released on 21st September in US, GB, Germany & France. Italy & Spain on 28th September. Not yet released in China & Brazil).
Apple has increased its share from 18.1% to 28.0% in the past year across Britain, while in the US its share increased by 14.2 percentage points.
While this latest data set only includes one week of iPhone 5 sales, we can see that in markets with a large number of existing Apple customers, sales have already seen a significant boost. We expect this momentum to be fully realised in the next set of results.
Tomorrow the UK joins the likes of the US, Germany and much of Scandinavia with the rollout of EE’s superfast 4G network.
Chinese consumers are rarely loyal to their brands [June 29, 2013]
Bain & Company, a global business consulting firm, and Kantar Worldpanel, a global leader in consumer panel insights, released the 2012 China FMCG Shopper report in Beijing. In most of 26 of the top consumer goods categories sold in China across packaged foods, beverages, personal care and homecare, covering more than 80 percent of the country’s fast-moving consumer goods (FMCG) market, shoppers who purchase more frequently in a category tend to buy more brands rather than more of the same brands.
Kantar Worldpanel equips shoppers from 40,000 households throughout urban China with barcode scanners to record their purchases from all channels. The findings dispel several misunderstood notions about how Chinese consumers respond to product brands. Although over 60 percent of Chinese shoppers have said that brands were their top consideration when purchasing (in previous Bain research), in reality, they rarely act on that consideration at the moment of purchase. Instead, they are in a near-constant state of trial, without leading to eventual preference and loyalty.
